NEW DELHI, INDIA (IST)
00:00:00 PM
|
Loading...
DETECTING LOCATION...
00:00:00 PM
|
Loading...
| S.N. | State / UT | Container Traffic |
|---|---|---|
| 1 | Maharashtra | 73,00,000 |
| 2 | Gujarat | 65,00,000 |
| 3 | Tamil Nadu | 25,00,000 |
| 4 | Andhra Pradesh | 18,00,000 |
| 5 | Karnataka | 8,00,000 |
| 6 | Kerala | 6,00,000 |
| 7 | Odisha | 4,00,000 |
| 8 | West Bengal | 3,00,000 |
| 9 | Goa | 1,00,000 |
| 10 | Puducherry | 50,000 |
| 11 | Andaman & Nicobar Islands | 0 |
| 12 | Arunachal Pradesh | 0 |
| 13 | Assam | 0 |
| 14 | Bihar | 0 |
| 15 | Chandigarh | 0 |
| 16 | Chhattisgarh | 0 |
| 17 | Dadra & Nagar Haveli and Daman & Diu (DNHDD) | 0 |
| 18 | Delhi | 0 |
| 19 | Haryana | 0 |
| 20 | Himachal Pradesh | 0 |
| 21 | Jammu & Kashmir | 0 |
| 22 | Jharkhand | 0 |
| 23 | Ladakh | 0 |
| 24 | Lakshadweep | 0 |
| 25 | Madhya Pradesh | 0 |
| 26 | Manipur | 0 |
| 27 | Meghalaya | 0 |
| 28 | Mizoram | 0 |
| 29 | Nagaland | 0 |
| 30 | Rajasthan | 0 |
| 31 | Sikkim | 0 |
| 32 | Telangana | 0 |
| 33 | Tripura | 0 |
| 34 | Uttar Pradesh | 0 |
| 35 | Uttarakhand | 0 |
| 36 | Punjab | 0 |
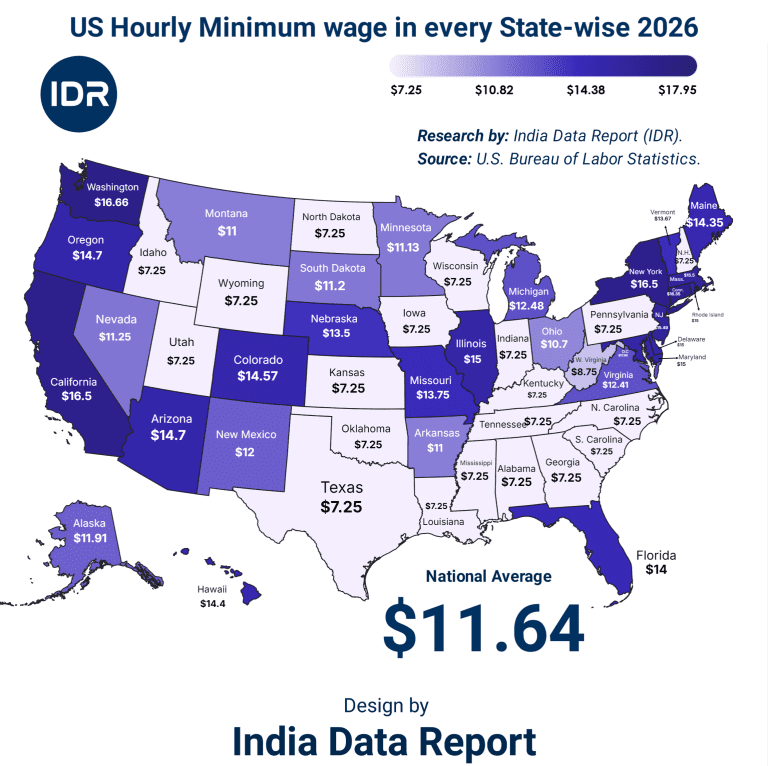
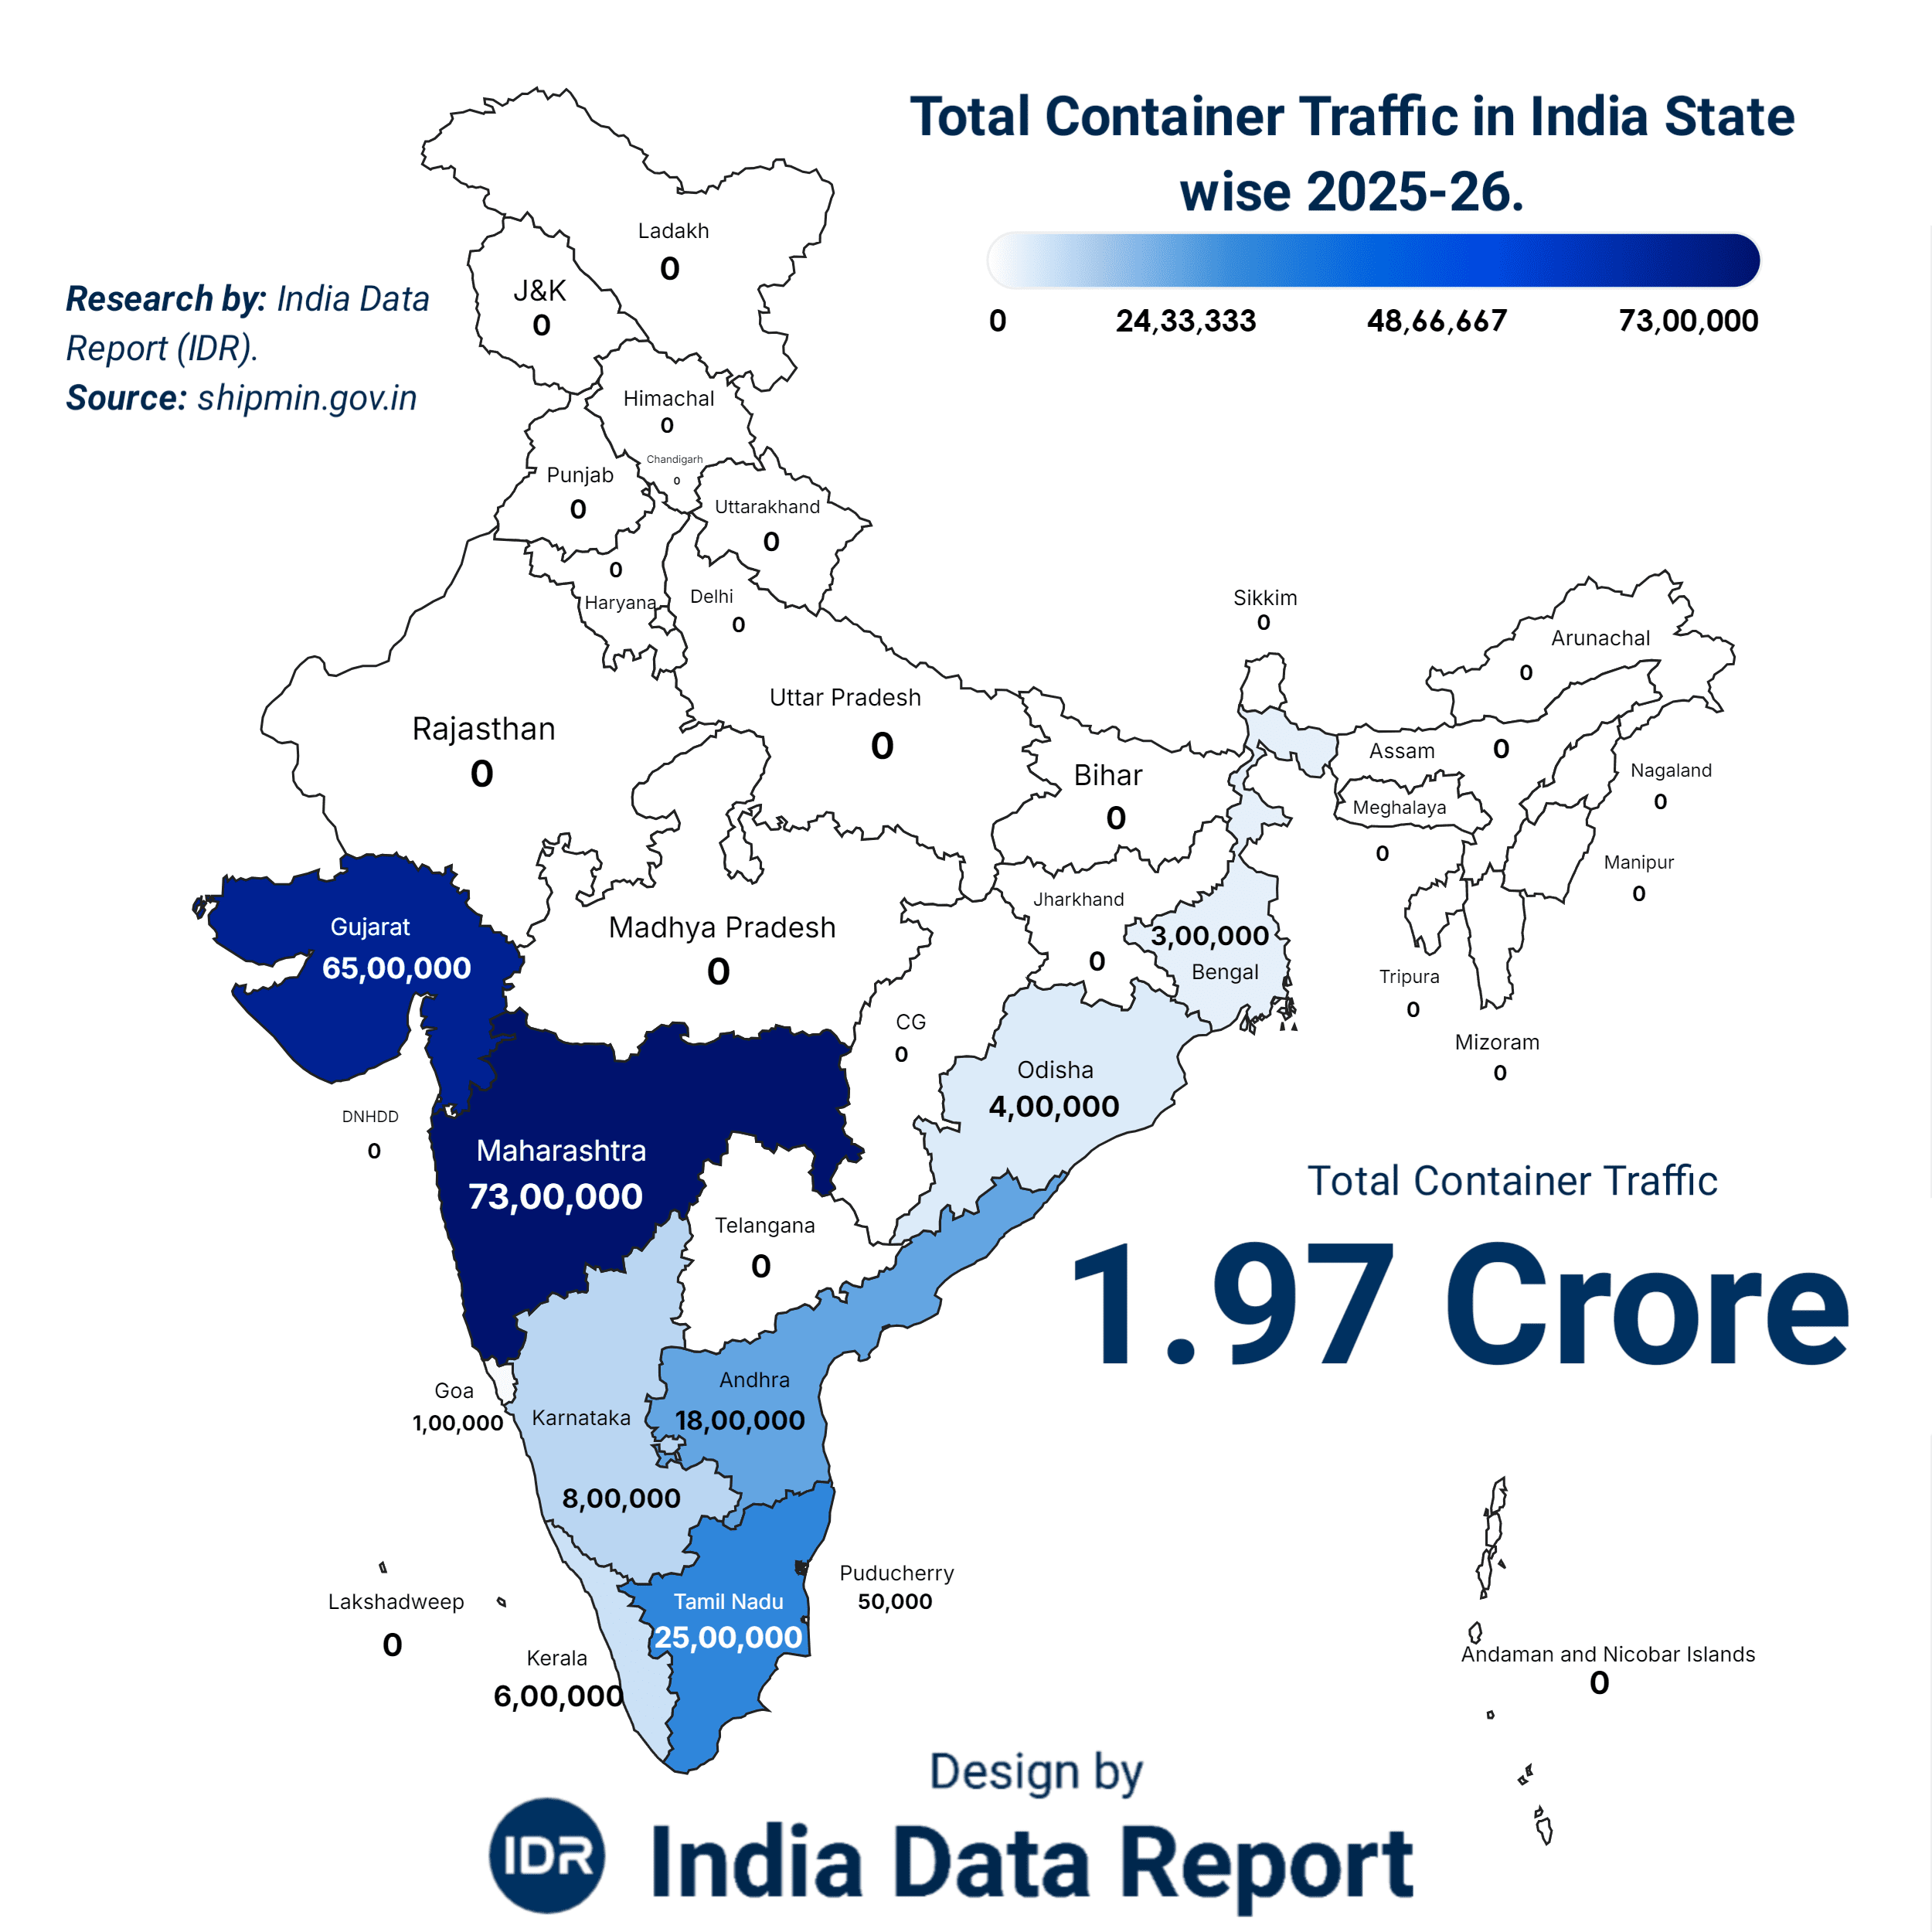
Listen closely, because the glossy brochures from the Ministry of Shipping won’t tell you what I’m about to. We are looking at a staggering 1.97 Crore TEUs (Twenty-foot Equivalent Units) moving through Indian waters in the 2025-26 fiscal year. On paper, it looks like a victory lap for “Make in India.” But as someone who has spent decades tracking the scent of money from the boardroom to the shipyard, I see a map of extreme imbalance that should keep every policymaker awake at night.
We talk about a “United India,” but our maritime economy is a lopsided beast. While Maharashtra and Gujarat are practically carrying the nation’s entire trade weight on their shoulders—hauling a combined 1.38 Crore TEUs—the rest of the coastline is essentially playing catch-up in the minor leagues. This isn’t just a statistic; it’s a geographical bottleneck that threatens our goal of a $5 trillion economy. If a single storm or a geopolitical flare-up hits the West Coast, India’s lungs stop breathing.
The rivalry between these two states is the engine room of India. Maharashtra leads the pack with 73 Lakh TEUs, largely driven by the sheer brute force of JNPT and the rising prowess of Vadhavan’s early-stage integrations. Gujarat is breathing down its neck with 65 Lakh TEUs, fueled by the aggressive efficiency of private players like Mundra.
But here’s the kicker: Why is the rest of India so quiet? Why does West Bengal, once the gateway to the East, languish at a pathetic 3 Lakh TEUs? It’s a tragedy of missed opportunities and bureaucratic rot. We are operating a Ferrari engine (the West Coast) on a cycle chassis (the East Coast).
| State | Container Traffic (TEUs) | % of National Share | Economic Sentiment |
| Maharashtra | 73,00,000 | 37.05% | Dominant / Overburdened |
| Gujarat | 65,00,000 | 32.99% | Aggressive / Efficiency-led |
| Tamil Nadu | 25,00,000 | 12.69% | Stable / Tech-driven |
| Andhra Pradesh | 18,00,000 | 9.13% | Emerging / High Potential |
The Bitter Truth: Two states control over 70% of India’s containerized trade. This isn’t a supply chain; it’s a tightrope walk. Any disruption here is not a local delay—it’s a national cardiac arrest.
Look at the data again. From Bihar to Rajasthan, Punjab to Uttar Pradesh, the list is a sea of zeros. Of course, these states are landlocked—they don’t have oceans. But that’s the amateur’s observation. The professional’s question is: Where are the Inland Container Depots (ICDs) and the Multi-Modal Logistics Parks (MMLPs)? The fact that Uttar Pradesh—a state that would be the world’s fifth-largest country by population—shows “0” on direct port-linked container metrics (in this specific dataset) highlights a massive disconnection in the “last mile.” The goods are being produced in the heartland, but the friction of moving them to the coast is eating our margins alive. In China, the integration of the hinterland with the coast is seamless. In India, it’s a grueling trek through archaic rail networks and clogged highways.
| Metric | West Coast (Maha/Guj) | East Coast (Odisha/WB) | The Hinterland (UP/Bihar/Punjab) |
| Turnaround Time | ~20-24 Hours | ~36-48 Hours | N/A (Logistics Friction) |
| Last-Mile Tech | High (Automation) | Moderate | Low / Manual |
| Growth Potential | Saturated | Massive | Untapped / High Risk |
The Golden Opportunity: The first player to successfully bridge the “Hinterland Gap” with high-speed rail freight corridors will own the next decade of Indian wealth. The zeros in the data aren’t absences; they are invitations for massive infrastructure plays.
Greed and fear drive markets. Right now, the “Fear” is the global supply chain shifting away from China (“China + 1”). The “Greed” is India trying to swallow that entire pie. But look at Goa (1 Lakh) or Odisha (4 Lakh). These are states with deep-water potential that are being treated like backwaters. We are celebrating 1.97 Crore TEUs as if we’ve arrived. To put it in perspective, Shanghai alone handles over 4.7 Crore TEUs annually. We aren’t even playing the same sport yet.
We are currently witnessing a “Correction of Intent.” The government is throwing money at Sagarmala, but money doesn’t move containers—efficiency does. You can build a berth, but if the customs official still wants a physical signature on a digital form, the ship will sail to Colombo or Singapore instead.
We are standing at a crossroads. 2026 is the year we decide if we are a maritime nation or just a nation with a long beach. The data says we are lopsided, vulnerable, and dangerously dependent on two states.
I have analyzed the numbers, and the smell of stagnant water in our minor ports is unmistakable.
While the West Coast celebrates its dominance, the East Coast of India is a graveyard of untapped potential and bureaucratic inertia. We are looking at a coastline that faces the booming economies of Southeast Asia, yet it handles a fraction of the traffic. Look at the numbers again: West Bengal at 3,00,000 TEUs and Odisha at 4,00,000 TEUs. This isn’t just a slow start; it’s an economic tragedy.
For decades, we’ve heard the “Look East” and “Act East” slogans. But the data suggests we are mostly “Watching East” while ships bypass our ports for Singapore or Colombo. Why? Because the East Coast is haunted by the ghost of Pre-Liberalization Lethargy. While private players transformed Mundra into a global beast, the Eastern ports remained shackled to the “Major Port Authorities” mindset—thick with red tape, union-driven delays, and a catastrophic lack of deep-draft facilities.
West Bengal should be the gateway to the Seven Sisters and the landlocked nations of Nepal and Bhutan. Instead, it’s a logistics bottleneck. With a measly 3 Lakh TEUs, the Kolkata and Haldia docks are essentially gasping for air. The riverine nature of these ports is an excuse; the real culprit is the failure to modernize.
Odisha, despite its massive mineral wealth and the presence of Paradip, sits at 4 Lakh TEUs. We are exporting raw dirt (ore) instead of value-added containers. It’s the “Resource Curse” in digital format. We have the land, we have the coast, but we lack the Aggressive Political Will to turn these into transshipment hubs.
| Port Region | Average Vessel Turnaround (2025) | Logistics Cost (% of Cargo Value) | Human Factor / Labor Issues |
| Gujarat Cluster | 18 – 22 Hours | 8% – 10% | Highly Professionalized |
| Tamil Nadu Cluster | 24 – 30 Hours | 11% – 13% | Moderate / Tech-Integrated |
| Bengal/Odisha Cluster | 45 – 60 Hours | 16% – 20% | High Union Interference |
The Bitter Truth: Shipping a container from Kolkata to Singapore often costs more and takes longer than shipping it from Mundra to London. We are pricing ourselves out of the global market before the ship even leaves the berth.
Here is the most painful truth: nearly 25% to 30% of India’s container cargo is “transshipped” through international ports like Colombo, Singapore, or Port Klang. We are essentially paying a “laziness tax” to our neighbors. Because our East Coast ports can’t handle the massive mother ships, our cargo is sent in smaller “feeder” vessels to foreign hubs, where it’s re-loaded.
Every time a container from Andhra Pradesh (18 Lakh TEUs) stops in Colombo, India loses money, time, and strategic leverage. We are building the Vizhinjam and Galathea Bay projects now, but where were we for the last thirty years? We were busy debating at the committee level while others were pouring concrete.
| Destination Hub | Estimated Indian Cargo Share | Why We Lose | Impact on Indian Exporters |
| Colombo (Sri Lanka) | ~40% of South India Cargo | Deep Draft & Location | High Feedering Costs |
| Singapore | ~15% of East Coast Cargo | Global Connectivity | Delayed Delivery Cycles |
| Dubai (Jebel Ali) | ~12% of West Coast Cargo | Superior Tech/Free Zones | Loss of Value-Add Income |
The Golden Opportunity: If India can claw back even 50% of its transshipped cargo by 2030, the East Coast traffic won’t just double—it will explode. But that requires firing the “Old Guard” and letting tech-first operators run the show.
Why is there no “Mundra” on the East Coast? Because the psychology in the East is still defensive. There is a fear of privatization, a fear of automation, and a fear of “the outsider.” While Tamil Nadu (25 Lakh TEUs) has managed to strike a balance between state-run and private efficiency (Ennore/Kattupalli), the northern part of the Bay of Bengal is stuck in a 1980s time warp.
Investors aren’t charities. They go where the friction is lowest. If I’m a global CEO, I look at the 1.97 Crore total, and I see a nation that is still “work in progress” rather than “market-ready.” We are feeding the West Coast until it chokes, while the East Coast starves. This isn’t just bad economics; it’s a strategic disaster.
If we don’t fix the East, the “China + 1” strategy will bypass India and head straight for Vietnam. They don’t care about our “potential”; they care about their Profit & Loss statements.
Let’s talk about the “Zeros.” Look at that list again—Rajasthan, Uttar Pradesh, Punjab, Haryana, Telangana. A sea of nothingness. If you’re a novice, you’ll say, “But they don’t have a coastline!” Congratulations, you’ve just fallen for the biggest smokescreen in Indian economics.
A state doesn’t need a beach to move a container. In a modern economy, the port should effectively start at the factory gate in Noida, Ludhiana, or Hyderabad. The fact that these states show 0 TEUs in direct coastal traffic is a glaring indictment of our broken Internal Arteries. We have built magnificent “Gateways” (Ports), but the “Corridors” (Rail and Road) leading to them are controlled by a fragmented, inefficient, and often predatory logistics mafia.
When a garment exporter in Ludhiana (Punjab) or a brass manufacturer in Moradabad (UP) wants to ship a container to New York, their nightmare doesn’t start at the Arabian Sea. It starts on the NH44.
We are currently operating with a logistics cost of 13-14% of GDP. Compare that to the 8% in developed nations. That 5-6% difference is the “Inefficiency Tax” that every Indian citizen pays. It’s the cost of trucks waiting 6 hours at state borders, the cost of “facilitation fees” at checkpoints, and the exorbitant freight rates charged by railway monopolies that prioritize passenger trains over the cargo that actually pays the bills.
| Origin City | Target Port | Distance (Km) | Transit Time (Days) | Cost per TEU (Approx) |
| Ludhiana | Mundra | 1,250 | 4 – 6 | ₹85,000 – ₹1,10,000 |
| Nagpur | JNPT | 800 | 3 – 5 | ₹60,000 – ₹75,000 |
| Hyderabad | Krishnapatnam | 500 | 2 – 3 | ₹45,000 – ₹55,000 |
The Bitter Truth: In many cases, it costs more to move a container from Haryana to Gujarat than it does to move that same container from Gujarat to Dubai. We have conquered the ocean, but we are being defeated by our own roads.
We talk big about Inland Container Depots (ICDs). These are supposed to be “Dry Ports” where customs clearance happens far from the coast. On paper, India has hundreds. In reality, many are glorified parking lots with crumbling infrastructure and “Digital Systems” that still require twenty physical stamps.
The “Logistics Mafia”—a loose confederation of local cartels, outdated brokerage networks, and corrupt middle-tier officials—thrives on this friction. They don’t want a seamless, blockchain-tracked, automated corridor. Why? Because Transparency is the enemy of the bribe. When a container is “lost” in a digital black hole for three days, someone, somewhere, is making money off the delay.
| Landlocked State | Industrial Output (Est. Growth) | Potential TEUs (Annual) | Actual Direct Port Credit |
| Uttar Pradesh | 12.5% | 15,00,000+ | 0 (Credited to Coast) |
| Telangana | 14.2% | 9,00,000+ | 0 (Credited to Coast) |
| Rajasthan | 9.8% | 7,50,000+ | 0 (Credited to Coast) |
The Golden Opportunity: The Dedicated Freight Corridors (DFC) are the only hope. But until the “Last Mile” connectivity (the short hop from the factory to the DFC station) is liberated from local cartels, the DFC will remain a high-speed train passing through a low-speed economy.
Why are we seeing 0 TEUs for Telangana? This is a state that is a global hub for Pharmaceuticals and IT hardware. They are producing millions of dollars worth of exportable goods. But because the credit for those containers is swallowed by the port states (Andhra Pradesh or Maharashtra), the inland states lack the “Maritime Data Identity” to negotiate better global shipping rates.
We are treating our inland states like “feeders” rather than partners. The psychology of a manufacturer in Indore is one of frustration—he is fighting the global market with one hand tied behind his back by domestic logistics.
If we don’t fix the Hinterland-to-Coast movement, our “Total 1.97 Crore” will plateau. We are currently picking the low-hanging fruit—the cargo that is produced near the coast. The real wealth of India lies in the 1,000 kilometers deep inside. Until that “Zero” on the chart turns into a “Hero,” India is just a coastal shopfront with an empty warehouse behind it.
Let’s strip away the diplomatic fluff. The fight for the 1.97 Crore TEUs isn’t just between states; it’s a war between two different ideologies: The Agile Private Giant vs. The Bloated State Machine. Look at the numbers. Maharashtra (73 Lakh) and Gujarat (65 Lakh) are neck and neck. But look under the hood. Maharashtra’s numbers are heavily supported by JNPA—a government-run behemoth that, despite its modernization, is often bogged down by its own weight. Gujarat, on the other hand, is the playground of Mundra and Pipavav. These aren’t just ports; they are high-frequency trading floors for physical goods.
While a state-run port might wait for a committee to approve a new crane, a private operator in Gujarat has already installed five, automated the gate entry, and cut the turnaround time by six hours. This is why Gujarat is the “Predator” in this ecosystem. It’s not just handling cargo; it’s stealing it from other states.
| Feature | Private Terminals (e.g., Mundra/Kattupalli) | Government Ports (Major Port Authorities) |
| Vessel Dwell Time | 12 – 15 Hours | 24 – 32 Hours |
| Tech Adoption | AI-driven Yard Management | Legacy ERP / Manual Checks |
| Customs Speed | 100% Faceless / Rapid | Multi-stage Verification |
| Customer Service | Proactive / Commercial | Reactive / Administrative |
The Bitter Truth: The only reason Maharashtra is still #1 is because of its historical geography and proximity to Mumbai’s financial heart. In terms of pure operational “Alpha,” Gujarat’s private ports are already the champions.
In Part 2, I mentioned the East Coast’s decay. The reason the East is dying while the West thrives is Capital Courage. Private players have poured billions into the West Coast because they see a return on investment. On the East Coast, the moment a private player tries to enter, the “Socialist Ghost” wakes up. Unions protest, politicians demand “local quotas,” and the project sits in litigation for a decade.
But here’s the reality: Ships don’t care about your ideology. A global shipping line like Maersk or MSC will go where they can save $5,000 in fuel by docking faster. If Maharashtra doesn’t fully embrace the “Landlord Model” (where the government owns the land but private experts run the operations), Gujarat will surpass it by 2027.
| Private Operator | Major Hubs | 2025-26 Volume Handle (Est.) | Strategic Move |
| Adani Ports (APSEZ) | Mundra, Hazira, Vizhinjam | 45% of National Private Share | Port-to-Rail Integration |
| DP World | JNPT, Mundra, Cochin | 22% of National Private Share | Free Trade Warehousing |
| PSA International | JNPT, Chennai, Tuticorin | 15% of National Private Share | Deep-water Specialization |
The Golden Opportunity: The rise of Vizhinjam (Kerala) as a transshipment hub. With 6,00,000 TEUs currently, Kerala is finally playing the game. If Vizhinjam can poach even 10% of Colombo’s traffic, it will be the most profitable piece of land in South Asia.
I’ve walked these docks. I’ve seen the fear in the eyes of the old-school yard managers. They see the Automated Guided Vehicles (AGVs) and the AI-powered sorting systems as the enemy. But the real enemy isn’t the robot; it’s the Calendar.
In the global market, we are competing against the clocks of Dubai, Singapore, and Qingdao. Every minute a container sits idle, an Indian worker’s salary loses its purchasing power. We are currently seeing a “Survival of the Fastest.” The 1.97 Crore TEUs are flowing toward the path of least resistance.
The “Corporate Takeover” isn’t a conspiracy; it’s a Rescue Mission. Without private capital and their obsession with “Seconds per Move,” India would still be stuck at 1 Crore TEUs, wondering why the world is passing us by.
We’ve looked at the maps, the “Zero” states, and the corporate bloodbath for dominance. Now, let’s stop looking at where we are and look at where we are going—or rather, where we must go if we don’t want to remain a “logistics dinosaur.”
The figure of 1.97 Crore TEUs is a respectable milestone, but in the context of a $5 Trillion dream, it’s peanuts. By 2030, if India does not hit 5 Crore TEUs, we will have failed to capture the global manufacturing shift. The “China + 1” window is not open indefinitely; it is a revolving door, and it’s currently spinning fast. Vietnam, Mexico, and even Poland are pushing for that same container space.
| State/Region | Projected 2030 Traffic | Status Change | Why? |
| Maharashtra | 1.5 Crore TEUs | The “Smart” Giant | Impact of Vadhavan Port completion. |
| Gujarat | 1.8 Crore TEUs | The National Leader | Pure private-sector aggression. |
| Kerala | 35 Lakh TEUs | Transshipment King | Vizhinjam stealing Colombo’s lunch. |
| The “Zeros” (UP/PB/HR) | 80 Lakh TEUs (Indirect) | The “Hidden” Engine | DFC connectivity finally matures. |
India is currently a Two-Cylinder Engine (Maharashtra & Gujarat) trying to pull a 28-State Train. It’s unsustainable.
If I were the Economic Strategist for the PMO, my first move wouldn’t be building more berths; it would be firing the laggards. We need to privatize the management of the Eastern ports yesterday. We need to stop subsidizing inefficiency in the name of “labor welfare” when that very inefficiency keeps millions of other Indians in poverty by killing export competitiveness.
| Type | The “Black Swan” (Risk) | The “Golden Opportunity” (Reward) |
| Geopolitical | Red Sea/Suez disruptions. | IMEC (India-Middle East-Europe Corridor). |
| Economic | Global recession killing demand. | Becoming the world’s “Repair Hub.” |
| Internal | Labor strikes at Major Ports. | 100% Automation & AI Yard Management. |
Kadhwa Sach (The Bitter Truth): We can build the world’s largest statues and the longest highways, but if an Indian SME cannot ship a product to Europe as cheaply as a Chinese SME, we will never truly be a superpower. The “1.97 Crore” is a start, but the “5 Crore” target is where the real power lies.
To the Policy Maker: Stop looking at TEU growth in isolation. Look at the “Cost per Move.” If that doesn’t go down, the TEU growth is just inflation in disguise.
To the Investor: Follow the Dedicated Freight Corridors (DFC). The land around the DFC terminals is the new “Gold Coast” of India.
To the Citizen: Demand transparency in logistics. Every hour a truck sits at a toll or a container sits at a port, it’s your money being burned.
India is no longer “emerging.” We are here. But the sea is a harsh mistress—she only rewards the fast, the efficient, and the bold.
It’s not just geography; it’s capitalist courage. Gujarat’s private ports (like Mundra) and Maharashtra’s strategic depth (JNPT) have invested in high-speed automation while other states were stuck in “committee meetings.” They are the only ones with the “Deep Draft” capability to host the world’s largest mother ships.
It’s a “participation trophy.” While it shows growth, a single Chinese port like Shanghai handles over 4.7 Crore TEUs annually. India’s entire nation is currently doing less than half of one Chinese city. We are moving in the right direction, but we’re still jogging while the world is sprinting.
Because of statistical theft. These states produce a massive chunk of India’s exports, but because the containers are “cleared” and loaded at the coast, the credit goes to the port state. Until we have seamless “Port-to-Factory” digital tracking, the hinterland will remain the unsung, exploited engine of the economy.
The “Logistics Mafia” and Red Tape. Between the factory and the ship, your container faces archaic rail monopolies, state-border extortion, and “document fees.” We spend 13-14% of our GDP on moving things; the global gold standard is 8%. That 6% gap is the “Inefficiency Tax” killing your profits.
It has the DNA to do it. Vizhinjam is one of the few places on earth with a natural 20-meter draft. For the first time, India can stop “renting” ports in Sri Lanka or Singapore to move its own cargo. If we don’t screw it up with local strikes or political interference, it’s a trillion-dollar goldmine.