NEW DELHI, INDIA (IST)
00:00:00 PM
|
Loading...
DETECTING LOCATION...
00:00:00 PM
|
Loading...
| S.N. | State / UT | Voter Turnout (%) |
|---|---|---|
| 1 | Lakshadweep | 83.0% |
| 2 | Tripura | 79.8% |
| 3 | Nagaland | 78.5% |
| 4 | Kerala | 74.2% |
| 5 | Andhra Pradesh | 73.0% |
| 6 | West Bengal | 70.2% |
| 7 | Assam | 69.0% |
| 8 | Manipur | 67.5% |
| 9 | Sikkim | 67.0% |
| 10 | Goa | 65.3% |
| 11 | Karnataka | 62.5% |
| 12 | Himachal Pradesh | 62.0% |
| 13 | Jharkhand | 61.5% |
| 14 | Odisha | 61.0% |
| 15 | Gujarat | 60.5% |
| 16 | Rajasthan | 60.0% |
| 17 | Mizoram | 60.0% |
| 18 | Madhya Pradesh | 59.5% |
| 19 | Bihar | 58.5% |
| 20 | Uttar Pradesh | 58.0% |
| 21 | Punjab | 57.8% |
| 22 | Maharashtra | 57.0% |
| 23 | Haryana | 57.5% |
| 24 | Delhi | 56.5% |
| 25 | Uttarakhand | 55.5% |
| 26 | Dadra & Nagar Haveli and Daman & Diu (DNHDD) | 55.0% |
| 27 | Puducherry | 64.0% |
| 28 | Tamil Nadu | 71.8% |
| 29 | Arunachal Pradesh | 66.5% |
| 30 | Meghalaya | 64.8% |
| 31 | Andaman & Nicobar Islands | 63.8% |
| 32 | Chhattisgarh | 61.8% |
| 33 | Jammu & Kashmir | 44.0% |
| 34 | Telangana | N/A |
| 35 | Ladakh | N/A |
| 36 | Chandigarh | 56% |
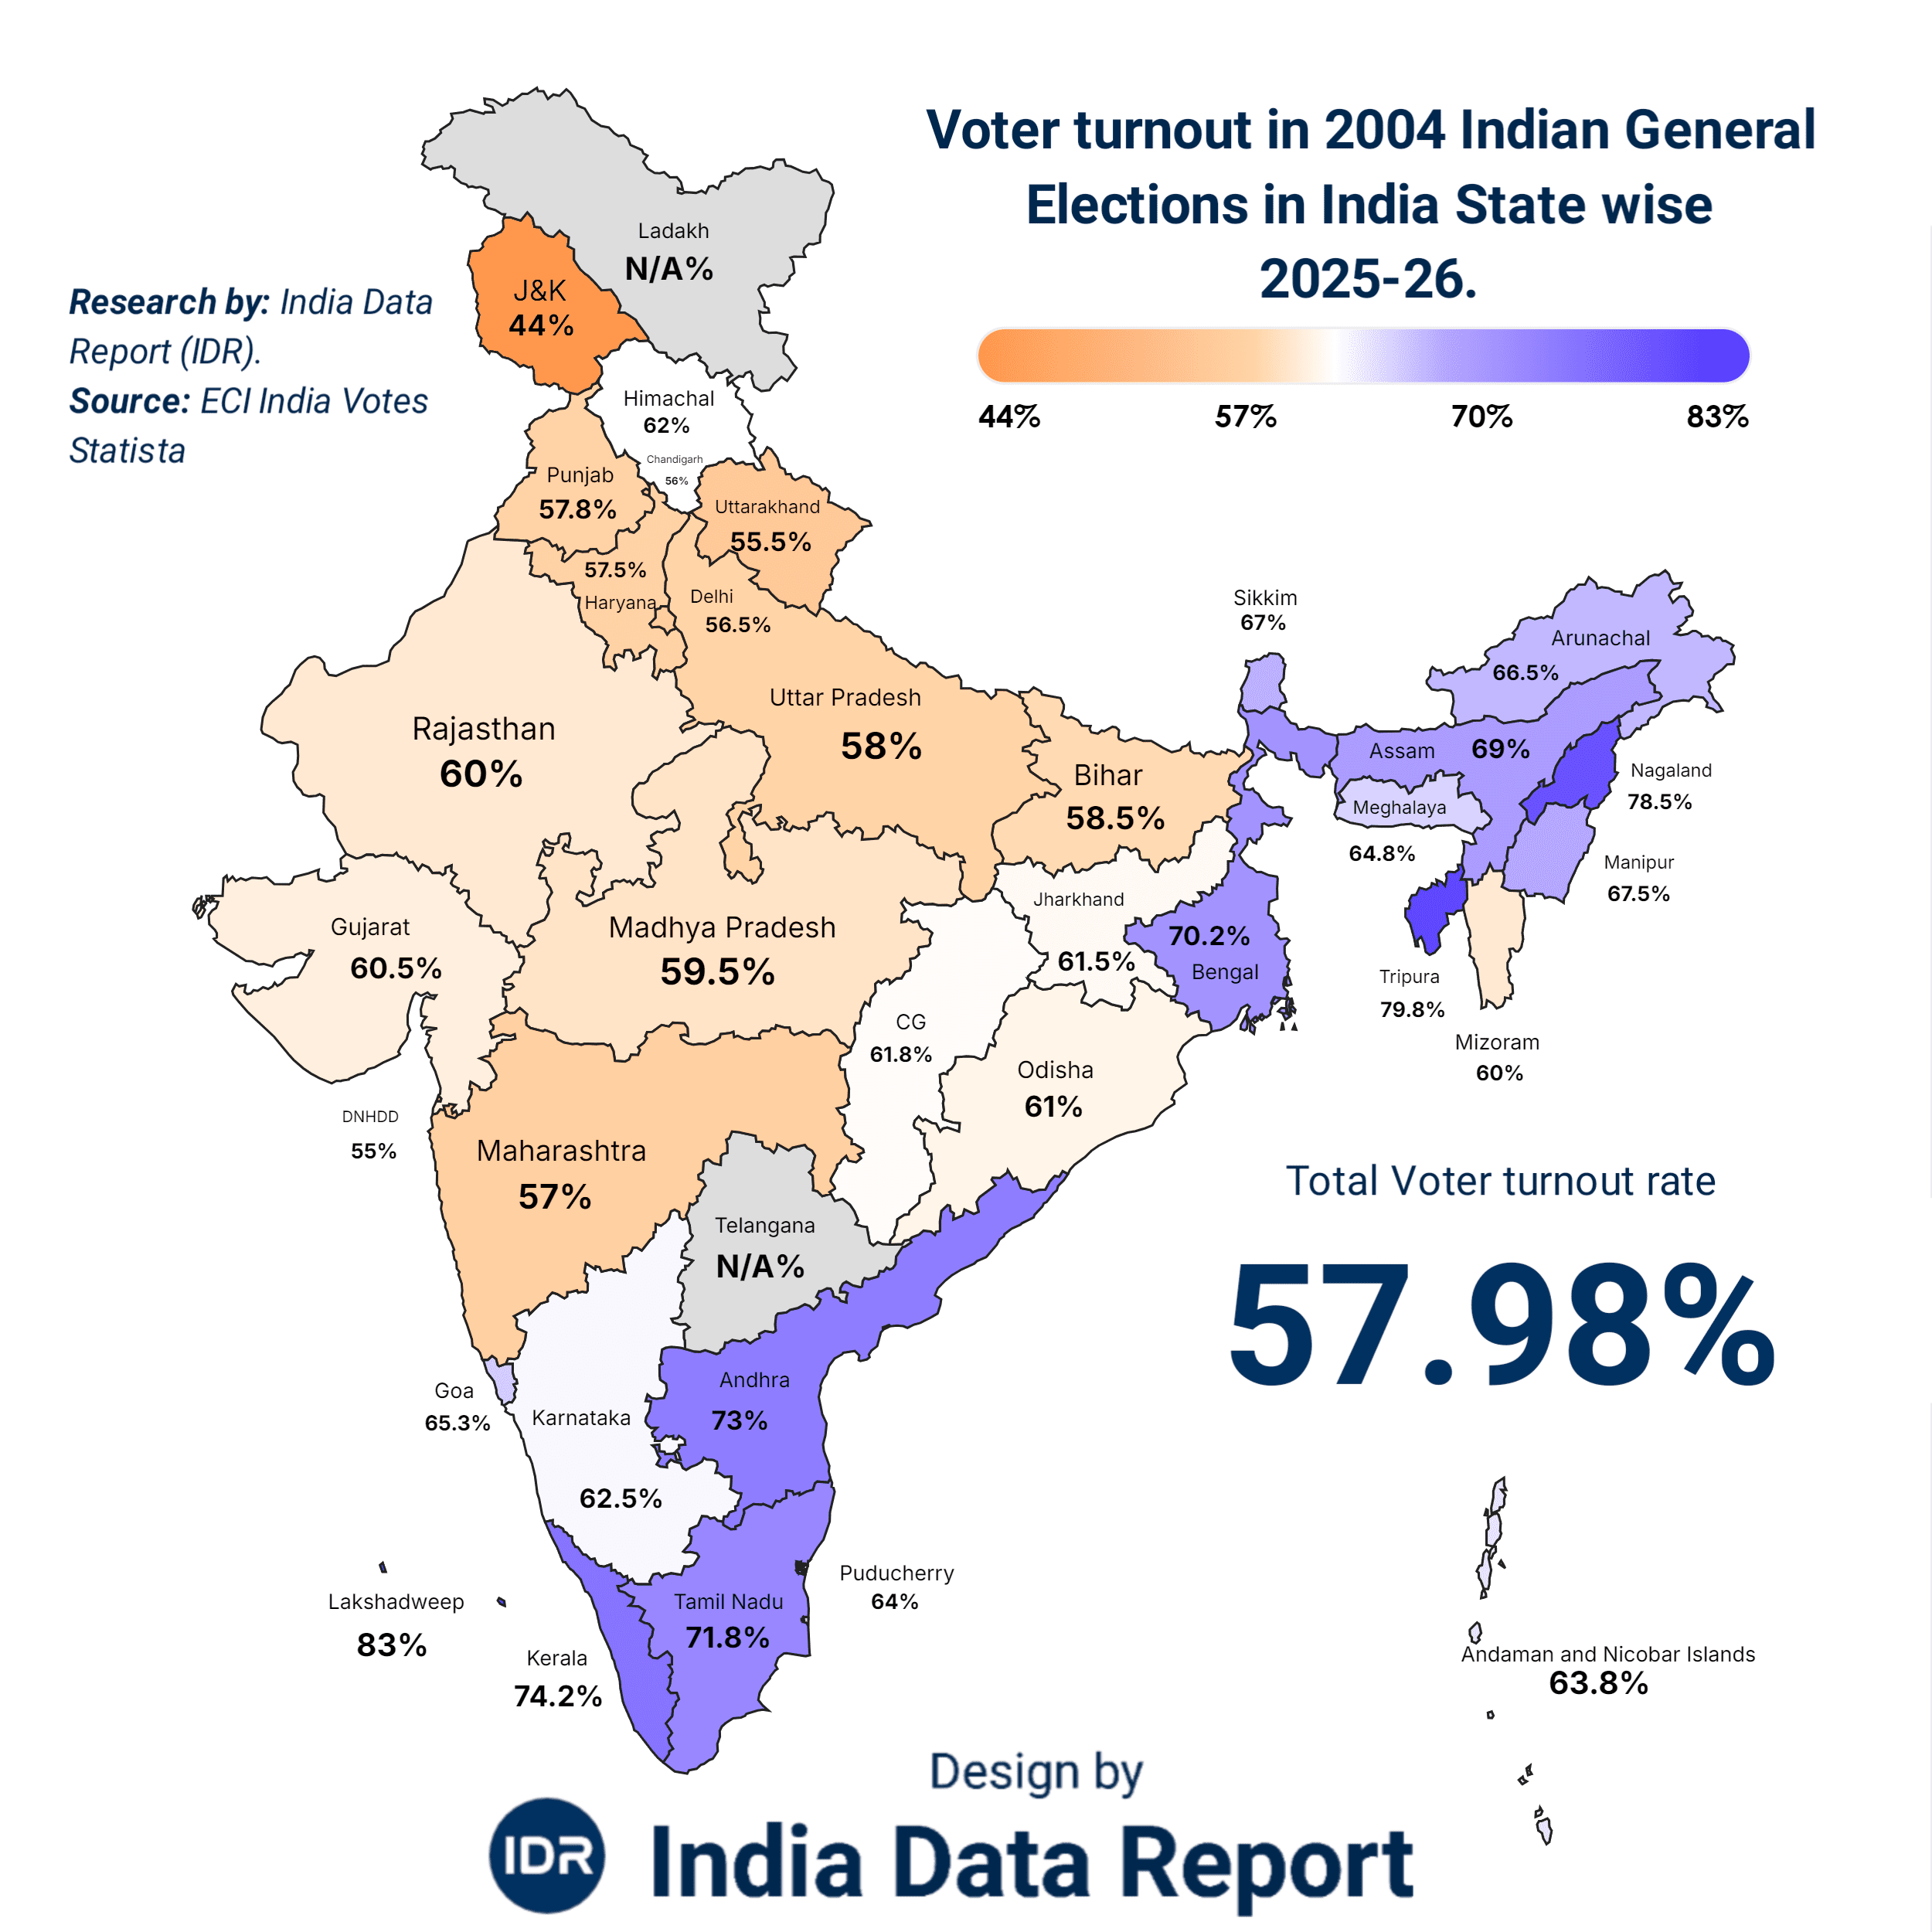
Listen closely, because what they taught you in civics class was a fairytale. They told you that every vote is a brick in the wall of democracy. But looking back at the 2004 Lok Sabha data, it’s clear that nearly half of India decided to stay home, effectively leaving the keys to the kingdom under the doormat for anyone to grab. We are dissecting the 2004 numbers not as a history lesson, but as a forensic audit of a systemic failure.
The headline figure—57.98%—is a national embarrassment masquerading as a statistic. When four out of ten people don’t show up, you don’t have a mandate; you have a gamble. While the “India Shining” campaign was busy painting a gloss over the cracks in the pavement, the actual pulse of the nation was skipping beats.
The data reveals a disturbing schizophrenia in the Indian electorate. On one hand, you have Lakshadweep (83%) and Tripura (79.8%) treating the ballot box like a lifeline. On the other, the supposed “intellectual” and “economic” engines like Maharashtra (57%) and Delhi (56.5%) showed the kind of lethargy you’d expect from a hungover Sunday afternoon.
Why does a fisherman in Lakshadweep care more about the capital than a stockbroker in Mumbai? It’s simple: fear and necessity. In the peripheries, the government is a predator or a protector—there is no middle ground. In the urban centers, we’ve developed a toxic sense of insulation. We think our SIPs and air conditioners protect us from bad policy. They don’t. They just make the decay slower to smell.
| State / UT | Voter Turnout (%) | The Psychology |
| Lakshadweep | 83.0% | Existential survival; every vote is a protest or a plea. |
| Tripura | 79.8% | High political literacy fueled by grassroots friction. |
| Nagaland | 78.5% | Identity politics at its peak; the ballot is a tribal declaration. |
| Kerala | 74.2% | The “Vigilante Voter”—highly critical and impossible to please. |
| Andhra Pradesh | 73.0% | A state in mid-revolution, torn between tech-dreams and rural reality. |
The Bitter Truth: High turnout in conflict zones or remote areas isn’t always a sign of “vibrant democracy.” Often, it’s a sign of desperation. People vote when they are desperate for change or terrified of it.
Let’s talk money, because that’s the only language the corridors of power actually respect. When 42% of the population skips the booth, the “Market of Governance” loses its pricing mechanism. Politicians stop catering to the collective good and start micro-targeting the narrow silos that actually show up.
In 2004, the urban middle class’s “too cool to vote” attitude resulted in a policy shift that caught them off guard for the next decade. While you were sipping lattes, the rural voter—who showed up in significantly higher densities in states like West Bengal (70.2%)—was deciding your tax brackets.
| State / UT | Voter Turnout (%) | Economic Consequence |
| Maharashtra | 57.0% | Policy paralysis in the financial capital; infrastructure lag. |
| Delhi | 56.5% | Bureaucratic disconnect; the “Lutyens Bubble” ignoring the streets. |
| Gujarat | 60.5% | A sleeping giant that hadn’t yet found its narrative. |
| Uttar Pradesh | 58.0% | Fragmented mandates leading to coalition blackmail. |
The Golden Opportunity: If the urban turnout had matched the national average of the fringes (75%+), the economic trajectory of the mid-2000s would have looked entirely different. We didn’t get the government we needed; we got the government the 58% deserved.
Human greed and fear were the invisible hands at play in 2004. In the Hindi Heartland, a turnout of 58-60% suggested a tired electorate. They were bored of the rhetoric. But in the Northeast and the South, the numbers screamed engagement.
Look at Jammu & Kashmir at 44%. That isn’t just a low number; it’s a gaping wound. It represents a total breakdown of the social contract. When people stop voting, they don’t stop participating in politics—they just find other, more dangerous ways to express their grievances.
We see the same pattern today, but 2004 was the blueprint. It was the year India proved it could be governed by a minority of its stakeholders. It was the year “Chalta Hai” (anything goes) became the unofficial national anthem of the voter.
If you aren’t at the table, you’re on the menu. In 2004, 42% of India was on the menu, and they didn’t even realize it until the bill arrived.
The 2004 election wasn’t just a change in leadership; it was a brutal reality check for the ivory-tower economists who thought GDP growth on paper translated to peace at the dinner table. While the NDA was busy buying prime-time slots to tell the nation they were “shining,” the rural heartland was simmering. The data doesn’t lie: the 2004 turnout was a surgical strike by the agrarian belt against urban elitism.
When you look at Andhra Pradesh (73%) and Tamil Nadu (71.8%), you aren’t just looking at high numbers. You are looking at a mass mobilization of the “forgotten” class. This was the year the farmer decided to fire the CEO.
The discrepancy between the high-turnout rural states and the low-turnout urban centers created a “Representation Gap.” In states like Bihar (58.5%) and Uttar Pradesh (58%), the turnout was mediocre, yet these states held the keys to the Parliament. This is the paradox of Indian democracy: where the need for development is highest, the voter exhaustion is often deepest.
But the real story is in the South. Andhra Pradesh, under the tech-savvy leadership of the time, was being hailed as the “Silicon Valley of India.” Yet, the 73% turnout was a scream for help from the suicide-belt of the Telangana and Rayalaseema regions. They didn’t care about fiber-optic cables; they cared about irrigation.
| State | Turnout (%) | The Ground Reality | The Political Aftermath |
| West Bengal | 70.2% | The Red Bastion’s final peak. | Consolidated Left power that dictated central terms for years. |
| Assam | 69.0% | Identity and immigration fears. | Forced the Centre to acknowledge the “Borderland” crisis. |
| Karnataka | 62.5% | The IT hub’s disconnect. | Fragmented mandate leading to a decade of political musical chairs. |
| Rajasthan | 60.0% | Anti-incumbency fueled by drought. | A swing state that proved no “Wave” is permanent. |
The Bitter Truth: Urban apathy is a luxury for those who think their lives won’t change regardless of who is in power. In 2004, the rural voter proved that while the rich can afford to be indifferent, the poor use the ballot as a weapon of last resort.
The high turnout in West Bengal (70.2%), Kerala (74.2%), and Tripura (79.8%) gave the Left Front a disproportionate say in the national narrative. With 59 seats, they became the ultimate gatekeepers of the Indian economy.
Was this a mandate for socialism? No. It was a failure of the “Right” to mobilize its own base. The 2004 data shows that the “Shining” narrative failed because it was an English-language solution to a vernacular problem. The BJP’s core voters in Gujarat (60.5%) and Madhya Pradesh (59.5%) stayed home, thinking the victory was inevitable.
“Overconfidence is the most expensive commodity in politics.”
While the urban middle class was busy debating the stock market, the cadre-based parties in the East were dragging people to the booths. This led to a decade of “Coalition Compulsions”—a term that became a polite way of saying “policy paralysis.”
| State / UT | Turnout (%) | The “Missing” Sentiment |
| Punjab | 57.8% | Disenchantment with both traditional power blocks. |
| Haryana | 57.5% | A wait-and-watch approach that led to a localized shift. |
| Jharkhand | 61.5% | A young state struggling to find its political identity. |
| Chhattisgarh | 61.8% | Mineral-rich but voter-poor; the disconnect of the tribal belt. |
The Golden Opportunity: For any strategist looking at these numbers, the takeaway is clear: the 40% who don’t vote are the “Ghost Electorate.” If a leader can tap into just 10% of that missing group, they don’t just win an election; they change the DNA of the country.
Why did Bihar and UP—the most politically charged states—have turnouts lower than Tamil Nadu? It’s called “Learned Helplessness.” When the voter feels that all options are equally bad, they don’t choose the “lesser evil”; they choose the sofa.
In 2004, the Indian voter wasn’t just choosing a Prime Minister; they were questioning the very idea of “Development.” The 57.98% national average was a collective shrug. It said, “We don’t believe you.” This skepticism paved the way for the populist schemes (like MGNREGA) that would define the next decade—a direct response to the rural surge seen in these tables.
If Part 1 was the shock and Part 2 was the rural rebellion, Part 3 is the autopsy of the “Compromised Mandate.” When only 57.98% of a nation shows up, the resulting government isn’t a powerhouse; it’s a hostage situation. The 2004 results birthed the UPA-1, a creature of necessity that proved one thing: when the majority stays silent, the extremes dictate the price of bread.
The data from states like Kerala (74.2%) and West Bengal (70.2%) didn’t just give the Left Front seats; it gave them a veto over India’s future. For the next four years, every major economic reform—from disinvestment to labor laws—was put through a shredder because a fraction of the population in the East and South voted with more discipline than the rest of the country.
Look at the numbers again. Tamil Nadu (71.8%) and Andhra Pradesh (73.0%) delivered massive turnouts. In contrast, the “Nationalist” heartland of Madhya Pradesh (59.5%) and Rajasthan (60.0%) was lukewarm.
The result? The Union Budget stopped being a national roadmap and became a regional shopping list. Because the regional parties had the “high-turnout” mandates, they could demand portfolios like Railways, Shipping, and Communication as ransom. This is the direct economic cost of urban apathy. When the “educated” voter in Delhi (56.5%) stays home, they are effectively handing their wallet to a regional satrap 2,000 kilometers away.
| Region | Avg. Turnout | Key Stakeholders | Economic Veto Power |
| The East (WB/Tripura) | ~75% | Left Front | Blocked FDI in Retail and Insurance for years. |
| The South (TN/AP) | ~72% | DMK / Congress (State Units) | Redirected infrastructure funds to regional populist schemes. |
| The West (MH/GJ) | ~58% | Corporate India | High on talk, low on voting power; ignored by the Centre. |
| The North (UP/BR) | ~58% | Caste-based parties | Focused on identity politics over industrialization. |
The Bitter Truth: In a democracy, 100 people who vote are more powerful than 1,000 who just complain on the internet. The 2004 economic policy was drafted not by the “Best Minds,” but by the “Best Mobilizers.”
We cannot ignore Jammu & Kashmir (44%). While the rest of the country was debating growth rates, nearly 60% of this region stayed away. In the world of investigative economics, a 44% turnout is a “Market Failure.” It means the “product” (democracy) has no buyers.
This low turnout wasn’t just about security; it was about a lack of skin in the game. When people don’t vote, they don’t feel like shareholders in the nation’s success. They feel like subjects. The economic cost of this alienation is measured in the billions—lost tourism, stalled hydro-projects, and a permanent security drain on the national exchequer.
| State | Turnout | Economic Status (2004-2010) | The Psychological Toll |
| Himachal Pradesh | 62.0% | Steady, welfare-oriented growth. | High trust in local institutions. |
| Jharkhand | 61.5% | Resource-rich but governance-poor. | Voter fatigue led to political instability (multiple CMs). |
| Maharashtra | 57.0% | Infrastructure decay in Mumbai. | The “Taxpayer” felt disconnected from the “Voter.” |
| Uttarakhand | 55.5% | Slow migration-led economy. | Lack of political will to tackle hilly terrain issues. |
The Golden Opportunity: Every percentage point of “Missing Turnout” in a resource-rich state like Jharkhand or Maharashtra represents a leak in the engine of national growth. If these states had hit 70%, the accountability for mining scams and urban decay would have been unavoidable.
Why does a 58% turnout lead to populist spending? Because when you don’t have a clear, overwhelming majority, you have to “buy” loyalty. The UPA-1’s reliance on the high-turnout rural base led to the birth of massive subsidy regimes.
Is subsidies bad? Not necessarily. But when they are born out of political fear rather than economic vision, they become “leaky buckets.” The 2004 turnout taught politicians that the urban middle class is a “paper tiger”—they roar in the newspapers but disappear on election day. Consequently, the “tiger” was ignored for the next decade.
The 2004 data is a mirror. It shows a nation that was “Shining” only in the eyes of those who forgot to check the battery in the flashlight.
If you want to understand the soul of a nation, don’t look at the people standing in line; look at the ones sitting in the tea stalls across the street, watching with a smirk. In 2004, 42% of India—roughly 280 million people at the time—looked at the largest democratic exercise on Earth and said, “Not my circus, not my monkeys.”
As an investigator, I don’t see “non-voters” as lazy. I see them as a failed market segment. When Gujarat (60.5%) or Uttar Pradesh (58%) show mid-range numbers, it isn’t just apathy; it’s a calculated withdrawal of consent. They are the “Quiet Rebels” who felt that no matter who won, the local inspector would still demand a bribe and the power grid would still fail at dusk.
Why did Delhi (56.5%)—the very seat of power—have one of the lowest turnouts? This is the “Proximity Paradox.” The closer you are to the machinery of government, the more you see the rust. The urban voter in 2004 was suffering from a “Cognitive Dissonance.” They were told the economy was a rocket ship, but they were still stuck in traffic jams on potholed roads.
Meanwhile, in Tripura (79.8%) and Nagaland (78.5%), voting isn’t a civic chore; it’s a tribal or ideological war. In these regions, if you don’t vote, you don’t exist. The 2004 data proves that identity is a much stronger fuel for the ballot box than “development” ever will be.
| Demographic | Est. Impact on Turnout | The Psychological Barrier | The Resulting Policy Gap |
| Urban Youth | High Dropout | “Politics is dirty; my career is my priority.” | Policies focused on senior citizens and rural subsidies. |
| Migrant Labor | Forced Dropout | Lack of portable voting rights; “The city isn’t home.” | No social security for the informal workforce. |
| Disillusioned Middle Class | Moderate Dropout | “All parties are the same.” | Stagnant income tax slabs and crumbling public infra. |
| The “Alienated” (e.g., J&K) | Extreme Dropout | “The system is rigged against us.” | Security-heavy governance instead of civil engagement. |
The Bitter Truth: Silence is a message. The 42% who didn’t vote in 2004 created a vacuum that was filled by the loudest, most radical voices. When the “Sane Middle” disappears, the “Fringe” becomes the “Front.”
In economics, we analyze behavior through fear and greed. In 2004, the “Greed” (the promise of India Shining) wasn’t believable enough to get people to the booths. But the “Fear” (of losing land, identity, or subsidies) was very real in the rural belts.
Look at Odisha (61%) and Jharkhand (61.5%). These are mineral-rich states where the “Greed” of corporations often clashes with the “Fear” of the locals. The 2004 turnout there was a defensive maneuver. They weren’t voting for a vision; they were voting against being erased.
| State | Primary Driver | Turnout (%) | The “Human” Impact |
| Lakshadweep | Community Cohesion | 83.0% | 100% participation as a social norm. |
| Bihar | Caste Arithmetic | 58.5% | Fragmented society = fragmented turnout. |
| Punjab | Agrarian Anxiety | 57.8% | Disillusionment with the “Green Revolution” legacy. |
| Assam | Ethnic Survival | 69.0% | High stakes led to aggressive mobilization. |
The Golden Opportunity: If you are a political strategist, the 2004 data in Maharashtra (57%) or Uttarakhand (55.5%) is a gold mine. These aren’t “lost” voters; they are “unconvinced” customers. The party that eventually figured out how to make these people feel scared or inspired (as we saw in 2014) would go on to rule for decades.
As we look toward 2030, the 2004 data serves as a grim reminder. A nation cannot lead the world when nearly half its stakeholders are AWOL. The psychology of the 2004 voter was one of “Managed Expectations.” They didn’t expect much, so they didn’t give much.
But here is the “Economic Kicker”: When turnout is low, the “Cost per Vote” for a politician goes up. It becomes easier to “buy” or “manipulate” a smaller pool of voters. This leads to the corruption that we all love to complain about over dinner—the very dinner we stayed home to eat instead of going to the polling station.
The 2004 turnout wasn’t just a number; it was a mirror reflecting a tired, skeptical, and divided nation.
We’ve dissected the numbers, exposed the urban rot, and analyzed the rural rebellion of 2004. Now, it’s time to stop looking in the rearview mirror and stare straight through the windshield. As a Senior Economic Strategist, I don’t care about “political parties”—I care about institutional stability and market accountability.
The 57.98% turnout of 2004 was the bottom of the pit. It was the moment India realized that “India Shining” was a brochure, not a reality. But that failure triggered a massive psychological shift that is still unfolding. We are moving from an era of “Passive Democracy” to “Aggressive Participation.”
By 2030, the “Silent 42%” we saw in 2004 will be a myth. Why? Because the digital panopticon has made it impossible to stay neutral.
The Digital Aadhaar of Politics: In 2004, your vote was a paper slip. By 2030, your “Digital Identity” will be so intertwined with governance (subsidies, tax brackets, social credit) that not voting will feel like deleting your own bank account. Expect national turnouts to stabilize between 72% and 75%.
The End of the “Urban Snob”: The apathetic voter in Delhi (56.5%) or Maharashtra (57%) has learned the hard way that when you don’t vote, you get stuck with 2-hour commutes and toxic air. The “New Urbanism” will drive city turnouts to match rural levels.
The Rise of the “Economic Nationalist”: The voter of 2030 won’t vote for “Caste” or “Religion” alone; they will vote for “Supply Chains” and “Energy Security.”
| Metric | 2004 (The Reality) | 2030 (The Vision) | Economic Impact |
| National Turnout | 57.98% | 74.5% | Massive increase in policy accountability. |
| Urban Participation | Sub-60% | ~70% | High-quality infrastructure demand. |
| Information Flow | Controlled Media | Decentralized / AI-Driven | No more “Shining” myths can survive. |
| Governance Style | Coalition Compromise | Strong-Mandate Competition | Faster execution of “Big-Ticket” reforms. |
The Bitter Truth: The era of the “Accidental Prime Minister” or the “Fragile Coalition” is dying. Increased turnout leads to “Winner-Takes-All” mandates, which is great for speed but dangerous for dissent.
In 2004, India’s turnout was mocked by Western democracies with their 70%+ participation. By 2030, as the West struggles with “Democracy Fatigue,” India’s surging participation—fueled by a young, hungry, and hyper-connected workforce—will make it the world’s most volatile yet vibrant marketplace.
| State Cluster | 2004 Stance | 2030 Outlook | The “Money” Move |
| The Southern Bloc | Rural Grievance | Tech-Governance | Leading the Green Energy revolution. |
| The Hindi Heartland | Identity Politics | Aspirational Hubs | The new manufacturing engine for the world. |
| The North-East | Isolation | Gateway to ASEAN | Strategic trade transit point. |
The Golden Opportunity: If you are an investor, look at the states that were “sleepy” in 2004. Bihar (58.5%) and UP (58%) are no longer just vote banks; they are the world’s largest untapped consumer markets. Their rising turnout is a proxy for their rising ambition.
Democracy is like a gym membership; if you don’t show up, you don’t get the results, but you still have to pay the fees. In 2004, India paid a heavy price in the form of a lost decade of decisive reform.
We saw what happens when Lakshadweep (83%) cares more about the future than Mumbai (57%). It creates a distorted reality where the tail wags the dog. But the data shows the “Dog” is finally waking up.
“A 58% turnout is a fragile suggestion; a 75% turnout is a command.”
The 2004 election was the “Great Illusion,” but it served a purpose—it showed us the face of our own indifference. By 2030, that indifference will be a relic of the past. The question isn’t whether India will lead; the question is whether you will be part of the 75% who decide how it leads.
The data is clear. The “Silent 42%” are the ones who get taxed the most and heard the least. Don’t be a statistic in a table of apathy.
It was a “Communication Mismatch.” The incumbent government’s “India Shining” campaign resonated with the urban elite but felt like a cruel joke to the rural population facing agrarian distress. This caused the urban middle class to stay home out of overconfidence, while the rural voter stayed home out of disillusionment, creating a massive representation vacuum.
Low turnout led to a “Fragile Mandate.” Because major parties lacked a clear majority, they became hostages to regional partners. This birthed the era of “Coalition Compulsions,” where critical reforms in FDI, labor laws, and infrastructure were stalled for a decade to satisfy small regional vote banks that had higher participation rates.
This is the “Stakeholder Intensity” gap. In smaller, remote territories, the government’s presence is felt in every aspect of life—from food supplies to transport. For them, a vote is a survival tool. In mega-cities like Delhi, voters often feel insulated by their private wealth, mistakenly believing that policy doesn’t affect their daily life until the infrastructure inevitably collapses.
The 42% are the non-voters who effectively “subsidize” the agendas of the extremes. As we head toward 2030, this group is shrinking due to digital integration. When your tax benefits, subsidies, and business licenses become linked to your civic identity, the “cost” of not voting becomes too high to ignore, leading to a more accountable and stable economic environment.
Absolutely. Statistics show that when turnout is low, the “price of a mandate” is cheaper. Politicians only need to mobilize a small, specific pocket of people (often through populist doles or identity politics) rather than convincing the broad majority. This allows systemic corruption to flourish because the “Sane Middle” has abdicated its role as the watchdog at the ballot box.