NEW DELHI, INDIA (IST)
00:00:00 PM
|
Loading...
DETECTING LOCATION...
00:00:00 PM
|
Loading...
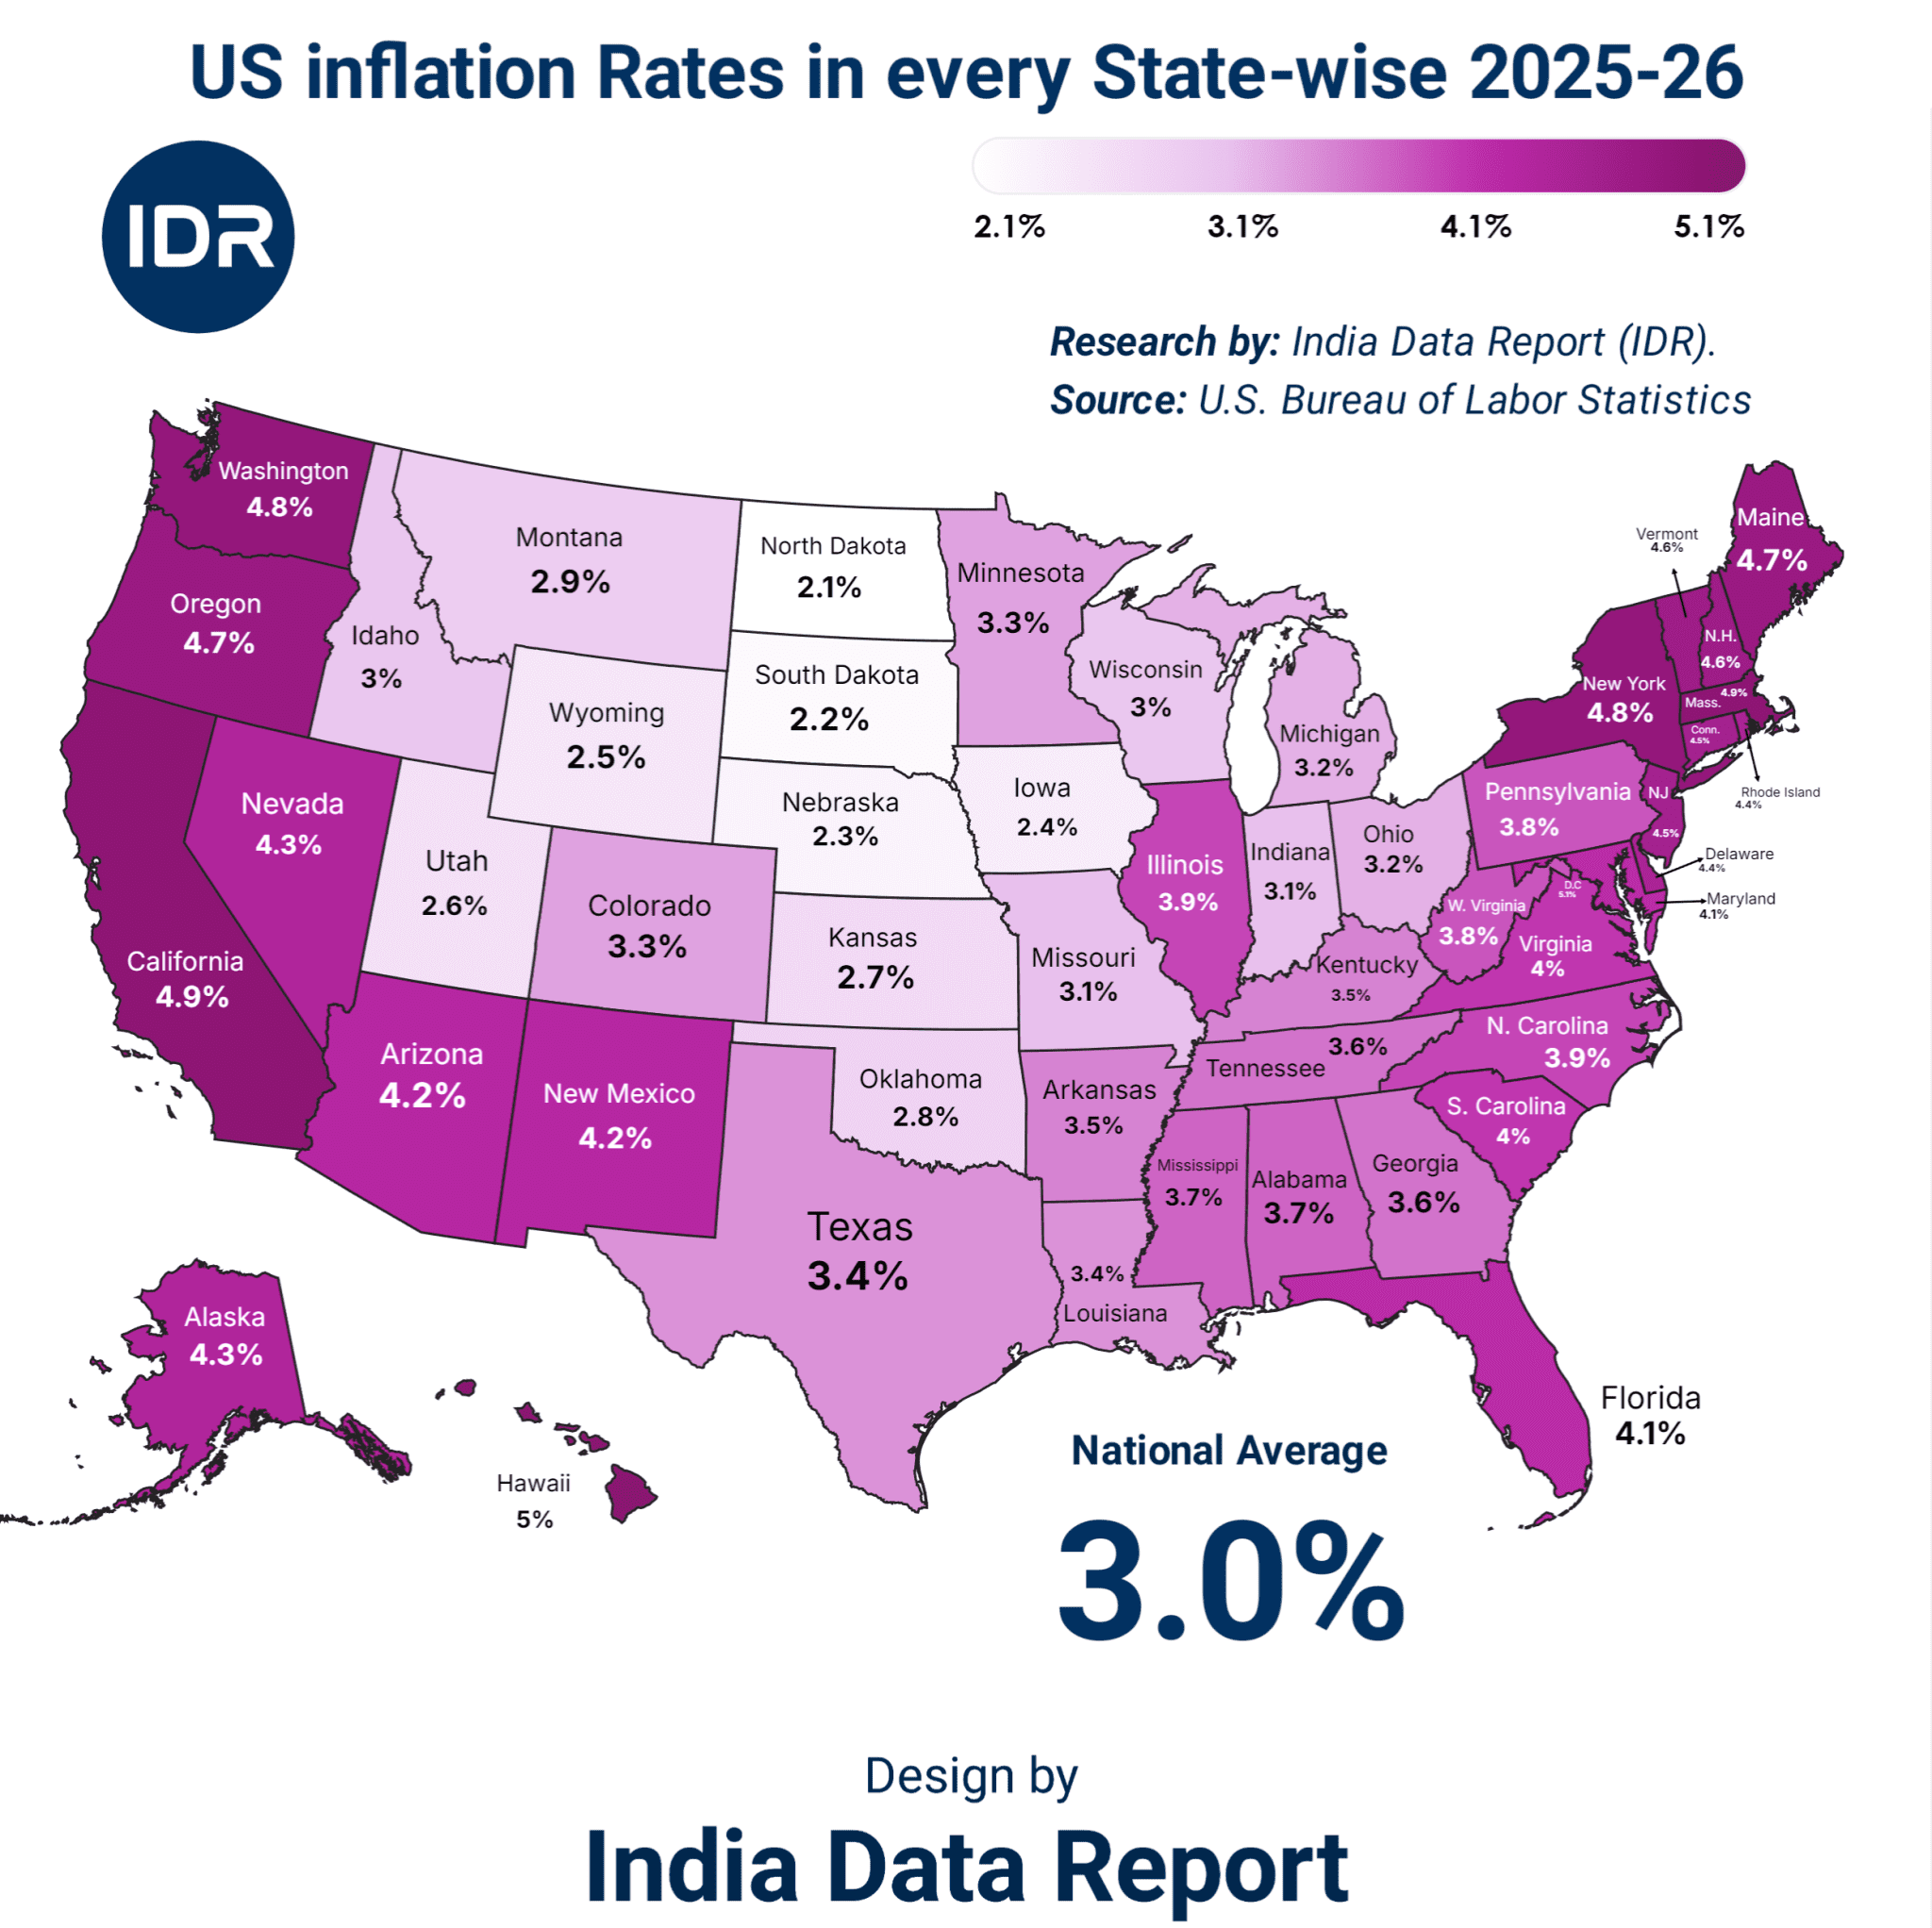
The American Dream isn’t just under pressure; it’s being liquidated. If you’re looking at the official 3.0% national inflation figure and feeling a sense of relief, you’re being played. That number is a convenient statistical veil, a “one-size-fits-all” shroud draped over a nation that is economically fracturing at the seams. While the suits in D.C. celebrate a “return to normalcy,” the reality on the ground in Honolulu or San Francisco is a brutal, daily dogfight for financial survival. We are witnessing the birth of two Americas: one that can afford to breathe, and one that is suffocating under the weight of a zip code.
| S.N. | State | Inflation Rate (%) |
|---|---|---|
| 1 | Hawaii | 5.0% |
| 2 | California | 4.9% |
| 3 | Washington | 4.8% |
| 4 | New York | 4.8% |
| 5 | Maine | 4.7% |
| 6 | Oregon | 4.7% |
| 7 | Virginia | 4.0% |
| 8 | South Carolina | 3.9% |
| 9 | Illinois | 3.9% |
| 10 | Pennsylvania | 3.8% |
| 11 | Mississippi | 3.7% |
| 12 | Alabama | 3.7% |
| 13 | Georgia | 3.6% |
| 14 | Kentucky | 3.6% |
| 15 | Arkansas | 3.5% |
| 16 | Texas | 3.4% |
| 17 | Louisiana | 3.4% |
| 18 | Minnesota | 3.3% |
| 19 | Colorado | 3.3% |
| 20 | Michigan | 3.2% |
| 21 | Ohio | 3.2% |
| 22 | Missouri | 3.1% |
| 23 | Indiana | 3.1% |
| 24 | Wisconsin | 3.0% |
| 25 | Idaho | 3.0% |
| 26 | Montana | 2.9% |
| 27 | Oklahoma | 2.8% |
| 28 | Kansas | 2.7% |
| 29 | Utah | 2.6% |
| 30 | Wyoming | 2.5% |
| 31 | Iowa | 2.4% |
| 32 | Nebraska | 2.3% |
| 33 | South Dakota | 2.2% |
| 34 | North Dakota | 2.1% |
| 35 | Arizona | 4.2% |
| 36 | Nevada | 4.3% |
| 37 | Florida | 4.1% |
| 38 | Alaska | 4.3% |
| 39 | New Mexico | 4.2% |
| 40 | North Carolina | 3.9% |
| 41 | Tennessee | 3.6% |
| 42 | Maryland | 4.1% |
| 43 | Delaware | 4.1% |
| 44 | New Jersey | 4.6% |
| 45 | Connecticut | 4.6% |
| 46 | Rhode Island | 4.0% |
| 47 | Massachusetts | 4.6% |
| 48 | Vermont | 4.6% |
| 49 | New Hampshire | 4.5% |
| 50 | West Virginia | 3.8% |
Let’s get one thing straight—nobody lives in an “average.” You don’t pay “average” rent or buy “average” eggs. You pay what the local market demands, and right now, the market is demanding your soul. When Hawaii sits at a staggering 5.0% and California follows closely at 4.9%, the national 3.0% average isn’t just a number; it’s a lie by omission. It ignores the geographic tyranny of the 2026 economy.
If you’re in the Northeast or the West Coast, you aren’t fighting inflation; you’re fighting an institutionalized hike in the cost of existing. We’ve moved past the supply chain excuses of the early 2020s. What we have now is “Structural Greed” baked into the local tax codes, insurance premiums, and energy costs of specific states. It’s a silent tax that no one voted for, but everyone is paying.
Look at the numbers. Really look at them. The spread between North Dakota (2.1%) and Hawaii (5.0%) is more than just a 2.9% gap; it’s a total lifestyle divergence. In Bismarck, you might still have a shot at a retirement fund. In Honolulu, you’re essentially working a second job just to fund the price increase on your first job’s commute.
The blue-chip states—Washington, New York, Massachusetts—are all hovering near the 5% mark. These are the supposed engines of the American economy. If the engines are overheating this badly, how long before the whole vehicle stalls? We are seeing a mass exodus, not of people who want to leave, but of people who are being financially evicted by the cost of milk and power.
| State | Inflation Rate (%) | Monthly “Surplus Tax” on $5k Spend | Economic Sentiment |
| Hawaii | 5.0% | $250 | Panic/Survival |
| California | 4.9% | $245 | Outward Migration |
| Washington | 4.8% | $240 | Tech-Wealth Buffer Only |
| New York | 4.8% | $240 | Infrastructure Decay |
| Maine | 4.7% | $235 | Heating Crisis Risk |
| Oregon | 4.7% | $235 | Stagnant Wages |
| Massachusetts | 4.6% | $230 | Education Bubble Stress |
| Connecticut | 4.6% | $230 | Middle Class Erosion |
| New Jersey | 4.6% | $230 | Tax Fatigue |
| Vermont | 4.6% | $230 | Rural Poverty Spike |
(The Bitter Truth): If your annual raise wasn’t at least 6% this year and you live in any of these top 10 states, you didn’t get a “raise”—you got a pay cut wrapped in a “good job” sticker. You are officially poorer than you were twelve months ago.
Why is 3% the magic number? Because it’s the threshold of “tolerable pain.” The Federal Reserve knows that if the national number stays at 3%, they can keep the interest rate games going without causing a full-scale riot. But this “stabilization” is a myth. It’s like telling a man whose hair is on fire that his feet are at a comfortable room temperature, so “on average,” he’s fine.
The American consumer is currently trapped in a psychological pincer move. On one side, there’s the “Greedflation”—corporations maintaining record margins because they know you’ve become desensitized to high prices. On the other, there’s “Shrinkflation”—the quiet theft of value where you pay the same for 20% less product. By the time you realize the cereal box is thinner, the money is already in the shareholder’s pocket.
| Region | Avg. Inflation | Primary Driver | Human Impact |
| West Coast | 4.7% | Housing & Energy | Homelessness & Flight |
| Northeast | 4.5% | Services & Insurance | Erosion of Savings |
| Midwest | 2.8% | Commodities | Relative Stability |
| The South | 3.6% | Population Influx | Infrastructure Strain |
(The Golden Opportunity): For the savvy investor or the mobile professional, the “Arbitrage of Living” is the only way to win. If you can earn a New York salary while living in a North Dakota (2.1%) economy, you aren’t just saving money—you’re reclaiming your freedom.
The data suggests a grim reality: the cost of the “American Lifestyle” is being localized. We are no longer one economy. We are a collection of economic islands, some of which are rapidly sinking. If you aren’t looking at these state-wise numbers, you’re flying blind into a storm that has already started.
You don’t get to 5.0% inflation in Hawaii or 4.9% in California by accident. It isn’t just “market forces.” It is a deliberate, structural failure of policy and a predatory feast by the gatekeepers of basic human needs. We are currently living through a period where the two most essential requirements for modern life—a roof over your head and the power to light it—have been turned into speculative assets.
In 2026, the American housing market has become a closed shop. Look at the states with the highest inflation: Washington (4.8%), New York (4.8%), and Massachusetts (4.6%). These aren’t just high-inflation zones; they are zones where the regulatory “Not In My Backyard” (NIMBY) culture has effectively banned affordable living.
When supply is choked by red tape, and institutional investors (the BlackRocks of the world) are outbidding families with all-cash offers, the “price” of a home ceases to be a reflection of value. It becomes a ransom. In high-inflation states, rent is now consuming 40-50% of the average worker’s take-home pay. This isn’t an “economic trend”; it’s a slow-motion eviction of the working class from the very cities they build and maintain.
Let’s talk about the elephant in the room that the politicians won’t touch: the cost of the “Energy Transition.” While we all want a cleaner planet, the burden of 2026’s energy shift is being dumped squarely on the shoulders of the consumer in states like Maine (4.7%) and Vermont (4.6%).
The electricity prices in the Northeast aren’t rising because of a global shortage; they are rising because of aging grids and the massive “transition costs” being passed down via utility bills. It’s a bitter irony: the most “progressive” states are often the ones where the poor are being priced out of basic heating. If you can’t afford to keep your house at 68 degrees in a Maine winter, the “average” inflation rate is a death sentence.
| State | Housing Inflation Component | Energy Hike (YoY) | The “Hidden” Reality |
| California | +7.2% | +11.4% | Forced migration to the desert |
| Hawaii | +8.5% | +9.1% | The death of the local middle class |
| Maine | +5.9% | +13.2% | Winter heating or groceries? |
| New Jersey | +6.4% | +8.8% | Commuter tax exhaustion |
| Illinois | +4.2% | +7.5% | Property tax death spiral |
(The Bitter Truth): Governments love high property values because they lead to higher property taxes. They have zero incentive to actually “fix” the housing crisis because their budgets are addicted to the very inflation that is killing you.
There is a monster lurking in the data that most economists ignore: Insurance. In Florida (4.1%) and Louisiana (3.4%), the “official” inflation looks manageable, but these numbers are deceptive. They don’t fully capture the 30-50% spikes in homeowners’ insurance.
In 2026, insurance is no longer a safety net; it’s a luxury. In many parts of the country, the cost of insuring a home is now higher than the property taxes. This is “Climate Inflation.” Whether you believe in the cause or not, you are paying the premium. Insurance companies are quietly redlining entire states, and those that remain are charging “escape-room” prices. If you can’t insure it, you can’t mortgage it. If you can’t mortgage it, the market crashes.
| State | Insurance Premium Spike | Grocery Mark-up | Reality Check |
| Florida | +42% | +4.5% | Retirement dreams are evaporating |
| Louisiana | +38% | +3.2% | Coastal erosion = Financial erosion |
| Texas | +18% | +3.1% | “Cheap Texas” is a myth of the past |
| Arizona | +15% | +4.9% | Water scarcity pricing is starting |
(The Golden Opportunity): The only way to survive this “extortion” phase is De-globalization of your own life. Grow what you can, invest in localized energy (solar/wind) if the ROI makes sense, and for heaven’s sake, move your capital out of high-regulation, high-insurance “trap” states before the liquidity dries up.
The real danger of 4.5%+ inflation in these key states isn’t just the math; it’s the psychological toll. When people realize that working harder doesn’t lead to getting ahead, but merely staying in place, the “social contract” breaks. We are seeing a rise in “quiet quitting” not just in jobs, but in citizenship. Why contribute to a system that views your paycheck as a buffet for utility companies and insurers?
The truth is, the 3.0% national average is a sedative. It’s meant to keep you calm while the state-level machines extract every last cent of your discretionary income. We are being conditioned to accept a lower standard of living, one “slight price adjustment” at a time.
Welcome to the era of the “High-Income Poor.” In 2026, we have reached a bizarre economic crossroads: unemployment is technically low, wages have “risen,” yet the average American feels like they are drowning. Why? Because the labor market is currently a victim of Lagging Compensation Syndrome. While your boss might point to a 4% raise as a victory, in states like Washington (4.8%) or California (4.9%), that “raise” is actually a mathematically certain loss of purchasing power. We are witnessing the death of the “Middle Class Comfort Zone.” In 2026, if you aren’t an owner of assets, you are merely a battery being drained by the coastal machines.
The government and corporate HR departments love talking about Nominal Wages—the actual dollar amount on your paycheck. They hate talking about Real Wages—what those dollars actually buy.
In states like Texas (3.4%) or Georgia (3.6%), the labor market is still breathing, but in the “High-Inflation Hexagon” (HI, CA, WA, NY, ME, OR), the disconnect is staggering. We are seeing a “White-Collar Recession” where tech and finance workers earning $150k are living the lifestyle that $75k bought a decade ago. The 2026 job market is a treadmill set to 10.0 speed; you’re running faster just to stay in the same place on the belt.
We are currently in the middle of the greatest internal migration in American history, driven not by adventure, but by desperation. Look at the data: people are fleeing Hawaii (5.0%) and New York (4.8%) for Iowa (2.4%) and South Dakota (2.2%).
This isn’t just about weather; it’s about The Purchasing Power Arbitrage. A software engineer in Seattle (4.8%) is looking at their bank account and realizing they are effectively “poorer” than a plumber in Fargo (2.1%). This is causing a “Brain Drain” in high-cost states that will haunt their tax bases for the next decade.
| State | Inflation Rate | Effective “Hidden Tax” | Real Value of $100k | Lifestyle Status |
| Hawaii | 5.0% | $5,000 | $95,000 | Struggling |
| New York | 4.8% | $4,800 | $95,200 | Rent-Trapped |
| Virginia | 4.0% | $4,000 | $96,000 | Breaking Even |
| Texas | 3.4% | $3,400 | $96,600 | Growth Mode |
| North Dakota | 2.1% | $2,100 | $97,900 | Thriving |
(The Bitter Truth): Loyalty to a company in 2026 is financial suicide. If you haven’t switched jobs or renegotiated your contract in the last 18 months, you are subsidizing your employer’s profit margin with your own standard of living.
Inflation doesn’t just hit the big items; it eats the “joy” out of the economy. When the cost of essentials (Housing, Energy, Food) spikes in states like New Jersey (4.6%) or Massachusetts (4.6%), the first thing to die is the service economy.
Restaurants, travel, and local entertainment are being hollowed out. Why? Because the “Discretionary Gap” has vanished. In 2026, the psychological impact of a $18 sandwich is more damaging than the $18 itself—it’s a constant reminder that the system is broken. People are retreating into “Economic Survivalism,” focusing only on the Four Walls: Food, Utilities, Shelter, and Transport.
| Commodity | Avg. Increase (High-Inflation States) | Avg. Increase (Low-Inflation States) | The “Why” |
| Grocery Staples | +6.2% | +2.8% | Logistics & Local Taxes |
| Commute (Gas/EV) | +9.4% | +3.5% | State Carbon Levies |
| Health Insurance | +12.0% | +5.0% | Administrative Bloat |
| Dining Out | +15.0% | +6.0% | Labor & Rent Pressure |
(The Golden Opportunity): The “Side-Hustle” is no longer a choice; it’s a hedge. In 2026, the most successful individuals are those with Non-Correlated Income Streams. If your primary salary is tied to a high-inflation state, your secondary income must be digital, global, or tied to a low-inflation commodity.
The Fed looks at productivity and wonders why it’s stalling. I’ll tell them why: it’s hard to be “productive” when you spend your lunch break calculating if you can afford to fix your car or if you should just take the bus. Financial stress is the ultimate productivity killer.
The 2026 worker isn’t “lazy”; they are Economically Exhausted. We are seeing the rise of “Mercenary Labor”—workers who have no connection to the mission of their firm, only to the dollar amount that keeps them one step ahead of the 5% inflation monster in Hawaii or California.
The most dangerous weapon in 2026 isn’t a missile; it’s a decimal point. We are currently witnessing a “Perfect Storm” where the Federal Reserve’s high-interest-rate sledgehammer is colliding with localized state inflation. This is creating a Debt Pincer Movement. If you live in a high-inflation state like Washington (4.8%) or California (4.9%), you aren’t just paying more for bread; you are paying a “Interest Premium” on every dollar you borrow to survive.
For decades, Americans used cheap credit as a pressure valve. If prices went up, you put it on the card. If you needed a house, you took a 3% mortgage. That era is dead and buried. In 2026, with the national average inflation still stubborn at 3.0%, interest rates aren’t coming down to the “easy money” levels of the past.
For a family in Hawaii (5.0%), this is a catastrophe. They are facing the highest cost increases in the country, but their ability to bridge the gap with credit is now prohibitively expensive. We are seeing the rise of “Subsistence Borrowing”—people taking on 24% APR credit card debt just to buy groceries. This isn’t building a future; it’s digging a grave.
Who benefits from this? Follow the money. In high-inflation corridors like New York (4.8%) and New Jersey (4.6%), the real winners are the “Rentiers”—the entities that own the debt and the assets.
When inflation stays high and rates stay high, the “Wealth Gap” becomes a “Wealth Canyon.” The top 1% own assets that inflate in value (like real estate and stocks), while the bottom 80% own “liabilities” (like car loans and student debt) that become harder to service as the cost of living eats their disposable income. In 2026, your debt is someone else’s dividend.
| State | Inflation Impact on Essentials | Avg. Credit Card Interest Paid | The “Discretionary Deficit” |
| California | +$4,200 | +$1,800 | -$6,000 |
| Washington | +$3,900 | +$1,650 | -$5,550 |
| Florida | +$3,100 | +$2,100 | -$5,200 |
| Ohio | +$2,200 | +$900 | -$3,100 |
| Iowa | +$1,400 | +$750 | -$2,150 |
(The Bitter Truth): The “Credit Score” has become the new social credit system. In 2026, a drop in your score doesn’t just mean a higher rate; it means being locked out of the only states where life is still affordable. You are being “Geo-Fenced” by your own debt.
While the average person is struggling, the “Bubble” hasn’t burst—it has just migrated. In states like Arizona (4.2%) and Nevada (4.3%), we are seeing a “Cost-Push” bubble. The prices are rising not because of organic demand, but because the cost of everything—from labor to copper to insurance—has forced prices upward.
This is the most dangerous kind of inflation. It’s not driven by a “booming economy”; it’s driven by Inflexible Overhead. When the cost of doing business rises, that cost is passed to you. If you can’t pay, the business closes. This is why we see “Ghost Storefronts” in Manhattan despite high “nominal” spending. People are spending more, but they are getting significantly less.
| Economic Indicator | 2021 Reality | 2026 Reality | The Psychological Shift |
| Savings Rate | 12% (Stimulus Era) | 2.4% | Fear-based living |
| Buy Now Pay Later | Novelty | A Necessity | Normalization of Debt |
| Multi-Job Households | 5% | 14% | The end of the 40-hour week |
| State-to-State Migration | Lifestyle Choice | Economic Asylum | Tactical Survival |
(The Golden Opportunity): 2026 is the year of Cash-Flow Sovereignty. If you have debt, kill it with fire. If you have cash, don’t let it rot in a 3% savings account when inflation in your state is 4.8%. Invest in “Productive Assets” that have pricing power—things that people must buy regardless of the price.
The media keeps talking about a “Soft Landing.” For whom? If you’re a billionaire in a penthouse, the landing is soft. If you’re a teacher in Oregon (4.7%) trying to figure out why your gas bill doubled, you’re hitting the tarmac at 200 miles per hour.
We are not “navigating” a recovery. We are managing a decline. The “Truth” that the 2026 data reveals is that the American economy is no longer a unified machine. It is a series of local fires, and the “National Average” is just the smoke.
We have stripped away the layers of statistical propaganda. We have exposed the “Average” as a lie, the “Labor Market” as a treadmill, and “Debt” as the new feudalism. Now, we look ahead. By 2026, the cracks are visible; by 2030, the American economic map will be unrecognizable. We are moving toward a “Bifurcated Republic” where your destiny isn’t determined by your degree or your grit, but by your ability to dodge the “Inflationary Zones.”
The high-inflation states of 2025–26 (Hawaii, California, New York, Washington) are currently cannibalizing their own future. When you maintain a 4.5% to 5.0% inflation rate while the rest of the country hovers near 2%, you aren’t “leading” the economy; you are taxing your talent out of existence.
By 2030, I predict a Massive Institutional Pivot. The “Sun Belt” and “Plains” states will no longer be the “flyover” country. They will be the new Silicon Valleys and Wall Streets, not because they are “techier,” but because they are solvent. Capital, like water, flows to the path of least resistance. Currently, the resistance in Oregon (4.7%) and Massachusetts (4.6%) is too high.
The truth is brutal: The 3.0% national average is a deliberate ceiling designed to keep the bond markets stable while the individual citizen is liquidated. If you stay in a high-inflation state without a 10% annual income growth, you are effectively choosing a lower social class.
We are entering the era of “Economic Darwinism.” The system will not save you. The Federal Reserve cannot “fix” Hawaii’s housing costs, and D.C. cannot “fix” California’s energy mismanagement. You are your own Central Bank now.
| Action Item | Why it Matters | The 2030 Payoff |
| Geo-Arbitrage | Move from 4.8% zones to 2.2% zones | +25% Real Wealth Gain |
| Asset Hardening | Shift from cash to “Commodity-Linked” assets | Protection against “Paper Devaluation” |
| Skill Pivot | Move to “Essential Service” or “Remote Tech” | Independence from local labor traps |
| Debt Eradication | Exit the 20%+ APR credit cycle | Survival during the “Credit Crunch” |
| The Loser Profile | The Winner Profile |
| W-2 Employee in a High-Tax/High-Inflation State | Solopreneur with Multi-State/Global Revenue |
| Fixed-Income Retiree in the Northeast | Asset-Rich Individual in the “Low-Cost Corridor” |
| The “Average” Consumer following D.C. Data | The “Analytical Maverick” reading the ground reality |
| Heavy Debt-Holder | Debt-Free Capitalist |
(The Bitter Truth): The “American Dream” is being exported to the states that still respect the value of a dollar. If you are waiting for prices to “go back to normal,” you are waiting for a ghost. This is the new baseline.
The next four years will be a period of “The Great Sorting.” You have two choices:
The Passive Victim: Stay put, complain about the $10 gallon of milk in 2028, and hope for a government subsidy that will never come.
The Active Architect: Recognize that the 3.0% national average is a mask. Look at the state-level data. Move your capital, your body, or your business to where the “Economic Friction” is lowest (States like North Dakota, Iowa, and Nebraska).
Don’t let the “National Average” gaslight you. Take your bank statements from 2024 and compare them to today. Calculate your Personal Inflation Rate based on your zip code.
Audit your Location: Is the “prestige” of your current state worth the 4.8% annual “tax” on your life?
Hedge your Currency: Move out of depreciating cash and into assets that the government cannot print—land, specific commodities, or high-yield energy infrastructure.
The data doesn’t lie, but the people who summarize it often do. You now have the truth. The question is, do you have the guts to act on it?
Because the “Consumer Price Index” (CPI) is a curated basket. It doesn’t account for the massive regional spikes in insurance, local utilities, and property taxes—the “fixed-cost” killers. In states like Hawaii (5.0%) or California (4.9%), your personal inflation rate is likely double the national headline. You aren’t crazy; the math you’re being told just doesn’t match the bills you’re paying.
It’s the only strategy left for the middle class. We call this Geo-Arbitrage. By moving from a 4.8% inflation zone to a 2.1% zone, you instantly increase your “Real Wage” without even getting a promotion. In 2026, your zip code is the most significant factor in your net worth’s growth or decay.
For the bottom 80%, the answer is a resounding No. While “Nominal” wages (the number on your check) have gone up, they are a lagging indicator. By the time your boss gives you a 4% raise, the cost of your commute and health insurance has already climbed by 6-8%. You are effectively being paid in “yesterday’s dollars” for “today’s work.”
Productive, cash-flowing assets in low-tax jurisdictions. Gold is a defensive play, and Bitcoin is a speculative one, but the real winner of 2030 will be the person who owns “essential” infrastructure—think local energy grids, farmland, or multi-family housing in states like Iowa (2.4%) or Nebraska (2.3%). If people need it to survive, and it’s located where the government isn’t taxing it into oblivion, you win.