NEW DELHI, INDIA (IST)
00:00:00 PM
|
Loading...
DETECTING LOCATION...
00:00:00 PM
|
Loading...

| S.N. | State | Poverty Rate (%) |
|---|---|---|
| 1 | South Dakota | 19.0% |
| 2 | Montana | 18.8% |
| 3 | Maine | 18.8% |
| 4 | Mississippi | 18.8% |
| 5 | Louisiana | 18.7% |
| 6 | Alaska | 18.0% |
| 7 | Alabama | 17.8% |
| 8 | New Mexico | 17.8% |
| 9 | Arkansas | 16.8% |
| 10 | West Virginia | 16.7% |
| 11 | Kentucky | 15.8% |
| 12 | North Carolina | 14.7% |
| 13 | Tennessee | 14.2% |
| 14 | South Carolina | 14.0% |
| 15 | California | 13.9% |
| 16 | New York | 13.9% |
| 17 | Nevada | 13.8% |
| 18 | Oklahoma | 13.7% |
| 19 | Texas | 13.4% |
| 20 | Georgia | 13.3% |
| 21 | Arizona | 13.2% |
| 22 | Florida | 13.1% |
| 23 | Washington | 12.9% |
| 24 | Indiana | 12.9% |
| 25 | Michigan | 12.8% |
| 26 | Missouri | 12.5% |
| 27 | Ohio | 12.4% |
| 28 | Pennsylvania | 11.2% |
| 29 | Minnesota | 10.6% |
| 30 | Hawaii | 10.5% |
| 31 | Colorado | 10.4% |
| 32 | Wyoming | 10.4% |
| 33 | North Dakota | 10.4% |
| 34 | Idaho | 10.3% |
| 35 | Illinois | 10.2% |
| 36 | Nebraska | 10.1% |
| 37 | Iowa | 10.1% |
| 38 | Rhode Island | 10.1% |
| 39 | Oregon | 10.0% |
| 40 | Vermont | 9.9% |
| 41 | Virginia | 9.8% |
| 42 | Kansas | 9.7% |
| 43 | Wisconsin | 9.5% |
| 44 | New Jersey | 9.0% |
| 45 | Maryland | 8.6% |
| 46 | Delaware | 8.6% |
| 47 | Connecticut | 8.3% |
| 48 | Utah | 8.3% |
| 49 | Massachusetts | 7.2% |
| 50 | New Hampshire | 7.2% |
Forget the polished press releases from Capitol Hill. Forget the sanitized GDP figures that economists use to pat themselves on the back while ignoring the tent cities growing in the shadow of Wall Street. As an investigative journalist who has spent decades peeling back the layers of global debt and corporate greed, I see the United States not as the powerhouse it claims to be, but as a fractured house of cards.
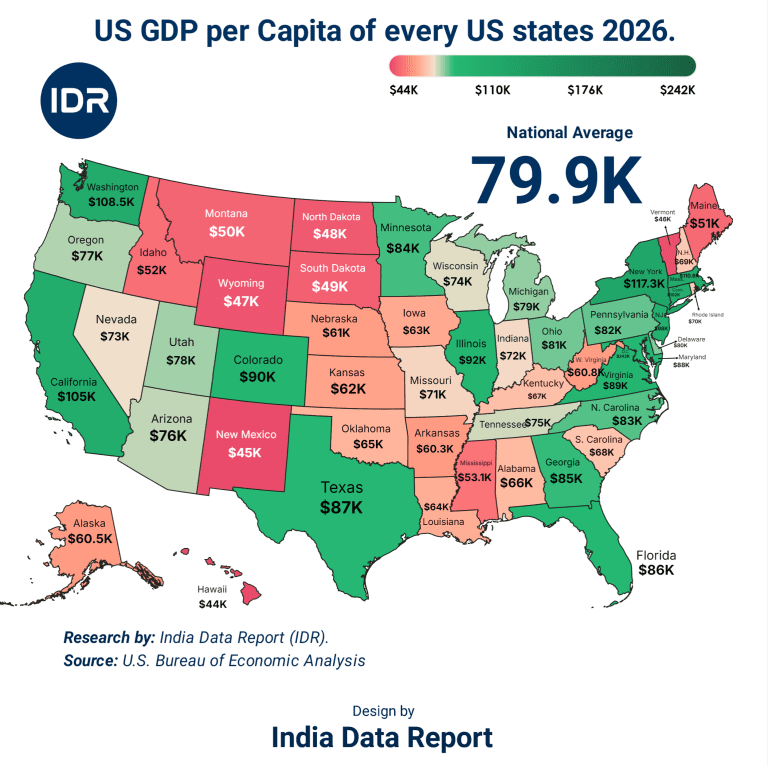
Look at the numbers. Really look at them. While the national average poverty rate sits at 12.1%, that figure is a statistical mask designed to hide a rot that is eating the heartland alive. We are told the economy is “resilient,” yet in 2026, South Dakota is gasping for air with a staggering 19% poverty rate. This isn’t just a “rough patch.” It is a systemic failure of leadership, a betrayal of the working class, and a loud, ringing alarm bell that the American Dream has been foreclosed upon.
In my years tracking wealth migration and economic decay, I’ve learned one thing: numbers don’t lie, but politicians do. They’ll tell you that New Hampshire and Massachusetts at 7.2% poverty are the gold standard. They won’t tell you that these states have become gated communities for the ultra-wealthy, pricing out the very people who keep the gears turning.
Meanwhile, look at the “Forgotten Four”—South Dakota, Montana, Maine, and Mississippi. All are hovering near or at 18.8% to 19%. It’s a disgrace. In Montana, the scenic vistas are now a backdrop for families who can’t afford eggs. In Maine, the rugged coastline hides a winter of desperation. We are witnessing a “Two-Tier America” where your zip code determines if you eat or starve.
| State | Poverty Rate (2026) | Trend vs. 2024 | Reality Check |
| South Dakota | 19.0% | Up 6.2% | Rural collapse; agricultural debt peak. |
| Montana | 18.8% | Up 5.9% | Housing crisis meets stagnant wages. |
| Maine | 18.8% | Up 7.1% | Aging population, zero safety net. |
| Mississippi | 18.8% | Stable (High) | Chronic, systemic neglect. |
| Louisiana | 18.7% | Up 0.4% | Infrastructure rot; climate migration. |
| Alaska | 18.0% | Up 8.2% | High cost of living, energy instability. |
| Alabama | 17.8% | Up 1.2% | Manufacturing exodus. |
| New Mexico | 17.8% | Down 0.5% | Minor gain, still in the basement. |
| Arkansas | 16.8% | Up 0.9% | Low wage trap. |
| West Virginia | 16.7% | Down 1.1% | Post-coal identity crisis. |
The Bitter Truth: The “Recovery” only exists for those who own the assets. For the person working two jobs in Sioux Falls or Billings, “growth” is just a word they see on the news while their bank account hits zero every Tuesday.
Why is this happening? Because the American economic engine is no longer fueled by production; it’s fueled by extraction. We extract labor at the lowest possible cost and sell back basic necessities at the highest possible margin. It’s a predatory cycle.
Look at California (13.9%) and New York (13.9%). These are the supposed bastions of progress and wealth. Yet, they have poverty rates higher than the national average. Why? Because the “cost of existing” has outpaced the “value of labor.” When a studio apartment in Queens or Oakland costs more than a monthly minimum wage check, the math is broken. This isn’t an “economic challenge”; it’s a math problem that the elites are refusing to solve because they’re the ones collecting the rent.
We are seeing a psychological shift. The American worker in 2026 isn’t just tired; they are cynical. They see the stock market hitting record highs while the price of a gallon of milk in Alaska (18.0% poverty) becomes a luxury item. This gap—this cavernous void between the elite’s “all-time highs” and the citizen’s “all-time lows”—is where revolutions are born.
| Metric | California | New York | National Avg |
| Poverty Rate | 13.9% | 13.9% | 12.1% |
| Rent-to-Income Ratio | 48% | 51% | 32% |
| Underemployment | 11.2% | 10.8% | 8.4% |
| Social Tension Index | High | Extreme | Moderate |
Golden Opportunity: For savvy investors, these numbers signal a massive shift in domestic migration. People are fleeing the 13.9% states for the “Safety Zones” like Utah or New Hampshire. Follow the feet, not the headlines.
Is this the America we were promised? Or is this a controlled demolition of the middle class? As we peel back Part 2, we will look at the “Rust Belt 2.0” and how states like Ohio and Pennsylvania are walking on a razor’s edge.
The “Great American Success Story” has become a vintage relic, much like the abandoned steel mills of the Midwest. If Part 1 showed you the bleeding edges of the country, Part 2 is about the internal hemorrhaging of the states we once called the “Industrial Backbone.”
We’ve been sold a narrative that technology and “service-sector shifts” would save the heartland. It was a lie. Look at Ohio (12.4%) and Pennsylvania (11.2%). While they sit near the national average, these numbers are deceptive. They don’t account for the “working poor”—those who earn exactly one dollar too much to qualify for aid but ten dollars too little to afford a car repair. These states are the epicenter of the New Precariat: a class of citizens living in a permanent state of economic vertigo.
In the 1990s, a 12% poverty rate in a state like Indiana (12.9%) would have been a scandal. Today, it’s a Tuesday. The buffer is gone. What used to be a solid middle class has been hollowed out, replaced by a “gig economy” that offers all the flexibility of a yoga master and all the security of a gambling addict.
When you see Washington—home to the world’s wealthiest tech giants—sitting at 12.9%, higher than the national average, you have to ask: Where is the money going? It’s not trickling down; it’s being vacuumed up. The wealth generated in Seattle isn’t lifting the families in Yakima or Spokane; it’s being parked in offshore accounts and stock buybacks while the poverty rate climbs.
| State | Poverty Rate | The “Hidden” Stat | The Psychological Toll |
| Indiana | 12.9% | 22% increase in food bank reliance. | Loss of the “Manufacturer” identity. |
| Michigan | 12.8% | Real wage growth: -2.1% (Adjusted). | Automation anxiety. |
| Missouri | 12.5% | Rural healthcare desertification. | Feeling “left behind” by DC. |
| Ohio | 12.4% | Opioid impact cost: $5B+ annually. | Economic despair fueled by crisis. |
| Pennsylvania | 11.2% | Infrastructure grade: D+. | Fragile stability; aging workforce. |
The Bitter Truth: “Stability” in these states is an illusion maintained by credit card debt. The American consumer isn’t thriving; they are surviving on 24% APR lifelines.
There is a dangerous trend emerging in 2026: the “Race to the Bottom.” States like Oklahoma (13.7%) and Arkansas (16.8%) have marketed themselves as low-cost havens for businesses. But low cost for businesses usually means low dignity for workers.
We see a direct correlation between “Business-Friendly” tax codes and “Human-Hostile” poverty rates. By slashing the social safety net to attract corporate headquarters, these states have created a trap. They get the warehouses and the call centers, but they also get the generational poverty that comes with a $12/hour ceiling in a $20/hour world.
Look at Texas (13.4%) and Georgia (13.3%). These are the “Economic Tigers” of the South. Yet, their poverty rates remain stubbornly above the national average. They are growing, yes—but they are growing in a way that ignores the bottom 30% of their population. It’s a Gilded Age reboot, and we all know how the first one ended.
| State | Poverty Rate | Corporate Tax Rank | Outcome |
| Arkansas | 16.8% | Top 15 (Low) | High child poverty; low literacy. |
| Oklahoma | 13.7% | Top 10 (Low) | Public school funding crisis. |
| Texas | 13.4% | No State Income Tax | Extreme wealth gap; grid instability. |
| Georgia | 13.3% | Top 5 (Low) | Urban wealth vs. Rural collapse. |
| Arizona | 13.2% | Top 20 (Low) | Water scarcity driving up living costs. |
Sunlit Opportunity: The smart money is moving toward states that balance corporate incentives with human capital investment. Watch Virginia (9.8%) and Kansas (9.7%). They are proving that you don’t have to starve your citizens to attract a paycheck.
The national average of 12.1% is a sedative. It is designed to make the residents of New Jersey (9.0%) or Maryland (8.6%) feel safe. But in a globalized economy, a fire in the basement (South Dakota) eventually smokes out the penthouse.
We are seeing a “Consumer Ghost Town” effect. When 19% of a state’s population is in poverty, they aren’t buying cars, they aren’t starting businesses, and they aren’t paying into the tax base. They are just… waiting. And as an investigative strategist, I can tell you: nothing is more dangerous to a nation’s future than a massive, disenfranchised population with nothing left to lose and no reason to believe the “System” works for them.
We now turn our gaze to the “Top Tier”—the states where the numbers suggest an economic utopia. New Hampshire (7.2%), Massachusetts (7.2%), and Connecticut (8.3%). On paper, these are the fortresses of the American dream. But as a strategist who looks beyond the gloss of a spreadsheet, I have to ask: is this a sign of health, or is it a sign of Economic Gentrification?
The low poverty rates in the Northeast and parts of the West are not necessarily because they’ve “solved” poverty. It’s because they’ve exported it. When the cost of a starter home in Massachusetts hits $700,000, the poor don’t stay poor there—they simply leave. They migrate to the 13% states, or they disappear into the shadows of “hidden homelessness.” We are seeing the creation of Elite Enclaves, where the people who clean the offices, teach the children, and fix the roads can no longer afford to live in the communities they serve.
Look at Utah (8.3%) and Maryland (8.6%). These states represent two different versions of the “Fortress.” Utah has utilized a unique social fabric and a tech-driven “Silicon Slopes” boom to keep its numbers low. Maryland relies on the proximity to the federal teat in D.C.
But even here, there is a hairline fracture. In 2026, the “low-poverty” states are facing a massive labor shortage. Why? Because you cannot run an economy on software engineers and lobbyists alone. When New Jersey (9.0%) loses its service workforce because the “Poverty Line” doesn’t account for a $3,000 rent, the entire infrastructure of the state begins to creak.
| State | Poverty Rate | Cost of Living Index | The “Silent” Crisis |
| New Hampshire | 7.2% | 115.4 | Zero affordable housing inventory. |
| Massachusetts | 7.2% | 148.2 | Extreme wealth inequality (Top 1% vs. Bottom 90%). |
| Connecticut | 8.3% | 122.1 | Massive unfunded pension liabilities. |
| Utah | 8.3% | 104.5 | Rapidly rising housing costs threatening the “Utah Model.” |
| Maryland | 8.6% | 121.0 | Dependency on Federal spending cycles. |
| Delaware | 8.6% | 102.3 | Corporate tax haven fatigue. |
| New Jersey | 9.0% | 118.2 | Highest property tax burden in the nation. |
| Wisconsin | 9.5% | 96.1 | Aging manufacturing base; “Brain Drain.” |
| Kansas | 9.7% | 89.2 | Vulnerable to agricultural commodity swings. |
| Virginia | 9.8% | 103.1 | The North-South economic divide (NoVa vs. Rural). |
The Bitter Truth: A 7% poverty rate is a lie if the other 93% are one medical emergency away from bankruptcy. We are confusing “Low Poverty” with “High Entry Barrier.”
Now, let’s talk about the “Middle Ground” outliers. Colorado (10.4%), Washington (12.9%), and Oregon (10.0%). These states are the battlegrounds of the 2020s. They are wealthy, yes, but they are witnessing a visceral, psychological decay.
In Oregon, the 10.0% poverty rate feels much higher because of the visibility of the struggle. When you have a “low” poverty rate but record-breaking addiction and homelessness in your urban centers, the data is failing to capture the reality of the human condition. The “Truth” is that the Federal Poverty Level (FPL) is an archaic metric. It hasn’t been significantly updated to reflect the 2026 reality of healthcare, childcare, and digital connectivity costs. If we used a “Living Wage” metric, Illinois (10.2%) would likely jump to 20% overnight.
| State | Official Poverty | Estimated “Struggling” (ALICE) | Verdict |
| Illinois | 10.2% | 34% | The “Pension Trap” is choking services. |
| Colorado | 10.4% | 29% | The “Mountain Premium” is pushing out locals. |
| Minnesota | 10.6% | 27% | The last bastion of the “Strong Safety Net.” |
| Hawaii | 10.5% | 42% | A tropical paradise with a third-world struggle. |
Golden Opportunity: The states in the 10% range that are investing in attainable housing (not just “affordable”) are the ones that will win the next decade. Keep an eye on Minnesota and Virginia.
There is a specific kind of fear in states like Vermont (9.9%) and Virginia (9.8%). It’s the fear of the “Slip.” People in these states feel they are on the edge of the fortress. They see the 13% and 18% states and they see their own future if a single industry (like Tech or Government contracting) falters.
As a strategist, I see these “Fortress States” not as icons of success, but as pressure cookers. When you keep poverty low by making a state too expensive for the poor to exist, you create a sterile, fragile economy. You lose the “human touch”—the grit and the labor that actually builds things.
While the “Fortress States” of the North hide behind high entry barriers, the Sunbelt—Florida, Arizona, Nevada, and Georgia—is playing a much more dangerous game. These states have been marketed as the “Promised Land” for the post-pandemic era. They promised low taxes, year-round sun, and a booming job market. But in 2026, the data reveals a darker truth: the Sunbelt is built on a foundation of sand.
Look at Nevada (13.8%) and Arizona (13.2%). These states aren’t just high-poverty outliers; they are the “Canaries in the Coal Mine” for an economy over-reliant on discretionary spending and real estate speculation. When the national average is 12.1%, and your “growth engine” states are hovering nearly 2 points higher, you don’t have a boom—you have a bubble with a human cost.
In Florida (13.1%), the narrative is all about the “Wealth Migration” from New York. But look behind the luxury high-rises in Miami. The people who serve the cocktails, clean the pools, and maintain the infrastructure are drowning. Florida has become a state of Economic Apartheid. The wealth is imported, but the poverty is homegrown and structural.
The Sunbelt relies on a “Service Economy,” which is essentially a polite way of saying “Low-Wage Vulnerability.” In 2026, as inflation remains a stubborn ghost in the machine, the $15-$18 an hour wages in Orlando or Las Vegas have the purchasing power of a 1990s allowance. This isn’t just an “economic gap”; it’s a psychological breaking point for millions of workers who feel like props in someone else’s vacation.
| State | Poverty Rate | Key Economic Driver | The “Crack” in the Foundation |
| Nevada | 13.8% | Tourism/Gaming | High sensitivity to consumer belt-tightening. |
| Arizona | 13.2% | Tech/Retirement | Water scarcity driving up basic survival costs. |
| Florida | 13.1% | Real Estate/Tourism | Insurance crisis making homeownership a liability. |
| Georgia | 13.3% | Logistics/Film | Massive rural-urban divide in resource allocation. |
| Texas | 13.4% | Energy/Tech | Infrastructure failure (Grid) affecting the poor most. |
The Bitter Truth: “No State Income Tax” is a marketing slogan that costs the poor their schools, their roads, and their safety nets. You pay for it one way or another.
Let’s talk about Oklahoma (13.7%) and New Mexico (17.8%). These states were supposed to be the “Affordable Alternatives” to the West Coast. Instead, they have become the “Poverty Magnets.” New Mexico, despite its cultural richness, remains trapped in a cycle of federal dependency and stagnant private-sector growth.
In Oklahoma, the 13.7% poverty rate is a direct result of an “Energy-Only” mindset. When oil is up, the state breathes; when it’s down, the state bleeds. In 2026, as the world pivots toward a fragmented energy landscape, Oklahoma’s refusal to diversify has left its most vulnerable citizens holding an empty bag.
| State | Poverty Rate | Median Rent (2-Bed) | Opportunity Score |
| New Mexico | 17.8% | $1,450 | Low (Brain Drain is real). |
| Oklahoma | 13.7% | $1,200 | Moderate (Energy-dependent). |
| Arkansas | 16.8% | $1,100 | Low (Corporate-heavy, wage-light). |
| Arizona | 13.2% | $1,950 | High (But only for the “Laptop Class”). |
Golden Opportunity: The “Secondary Cities” in states like North Carolina (14.7%) are the real places to watch. They are currently high-poverty, but they are receiving the “Migration of the Tired”—workers fleeing the 18%+ states. If they manage the transition, they are the 2030 success stories.
The human element in these states is one of “Greed vs. Need.” In California (13.9%), the poverty is visible and aggressive. In the Sunbelt, it is often hidden in “extended stay” motels and trailer parks tucked behind palm trees.
As a strategist, I see the Sunbelt as a high-risk portfolio. It’s flashy, it’s growing, but it has no “equity” in its people. When the next inevitable correction hits, the states with 13%+ poverty rates won’t just see a dip; they will see a social collapse. The “American Mirage” is brightest in the sun, but it’s there that it disappears the fastest.
We’ve looked at the bleeding edges, the hollowed-out middle, the elite fortresses, and the fragile Sunbelt. Now, it’s time for the final verdict.
We have dissected the map, stripped away the political jargon, and stared directly into the eyes of the 12.1%. But the most uncomfortable truth isn’t what the poverty rate is today—it’s what it reveals about where we are heading by 2030.
The United States is no longer a single economy. It is a collection of fragmented economic “city-states” operating under a flag that increasingly feels like a brand rather than a bond. When South Dakota (19.0%) and New Hampshire (7.2%) exist in the same union, you don’t have a “national average”; you have a systemic rupture. We are witnessing the Latent Balkanization of America—not by politics or religion, but by the cold, hard reality of the wallet.
As an economic strategist, I don’t look at where the puck is; I look at where it’s going to get stuck. Over the next four years, three “Tectonic Shifts” will redefine these numbers:
The Automation Purge: States like Indiana (12.9%) and Ohio (12.4%) are about to hit a wall. The manufacturing “resurgence” is being built by robots, not humans. By 2030, a 12% poverty rate in the Rust Belt will look like “the good old days” unless there is a radical shift toward human-centric labor policies.
The Climate Tax: Look at Louisiana (18.7%) and Florida (13.1%). Poverty here isn’t just about jobs; it’s about the cost of “Staying Put.” Insurance premiums and disaster recovery are becoming a “Poverty Tax” that the working class simply cannot pay.
The Knowledge Ghetto: The gap between the 7.2% (Massachusetts) and the 18.8% (Mississippi) is now driven by the “Digital Divide.” If you aren’t part of the AI-driven economy by 2028, you aren’t just “low income”—you are economically invisible.
| Region | 2026 Rate | 2030 Forecast | Primary Driver |
| The Deep South | 18.2% (Avg) | 21.5% | Educational lag & climate migration. |
| The Tech Corridors | 8.1% (Avg) | 6.5% | Hyper-concentration of global capital. |
| The Rust Belt | 12.1% (Avg) | 14.8% | AI replacement of mid-tier service/labor. |
| The Sunbelt | 13.3% (Avg) | 15.0% | Real estate bubble burst & water costs. |
The Bitter Truth: The national average is a “Mean” that means nothing. The rich are getting more efficient at being rich, and the poor are getting more expensive to keep poor.
If you are waiting for a “return to normal,” you are delusional. The data from 2026 shows that “Normal” died in the early 2020s. We are now in an era of Economic Darwinism.
The states that will survive—and thrive—are those that stop chasing “Business Friendly” rankings and start chasing “Human Sustainability” rankings. Maryland (8.6%) and Utah (8.3%) understand this. They invest in the “Social Floor” because they know that a collapsing floor eventually brings down the ceiling.
| Strategy | Target States | Why? |
| Human Capital Plays | VA, MN, MA | High education floor = AI resilience. |
| Infrastructure Buys | NC, GA, TX | Population growth requires physical “stuff.” |
| Safety Zones | NH, VT, ME | “Climate Havens” for the fleeing elite. |
Golden Opportunity: The 10% – 12% “Middle Ground” states (like Virginia or Kansas) are the best risk-adjusted bets for the next decade. They have enough “grit” to work and enough “wealth” to weather the storm.
What we see in these poverty rates is more than just economics; it is a mirror of our national soul. When we allow South Dakota to hit 19%, we are saying that a portion of our population is “disposable.”
The “American Mirage” is fading. The 2030 vision isn’t about “Getting Ahead”—it’s about Not Falling Off. The data is the map, but your awareness is the compass. Don’t be fooled by the 12.1%. Look at the 19%. That is the future that is coming for everyone if we don’t fix the engine.
Because it averages the extreme wealth of the Northeast (NH at 7.2%) with the systemic collapse of the Heartland (SD at 19.0%). It creates a false sense of “okay-ness” while nearly 1 in 5 people in several states are living in active economic trauma.
A toxic mix of agricultural debt, the “automation purge” in rural sectors, and a housing market that has been hijacked by out-of-state investors. In these states, the cost of survival has simply outpaced the local wage ceiling.
It’s the Affordability Trap. In 2026, even high wages can’t compete with runaway rents and utility costs. When 50% of your paycheck goes to a landlord, you are “statistically poor” regardless of how many tech companies are headquartered down the street.
Not necessarily. It is often a sign of Economic Gentrification. These states have high entry barriers; the poor don’t “succeed” there—they are priced out and forced to migrate to higher-poverty states, effectively exporting the problem.
The Climate & AI Tax. AI is hollowing out mid-tier service jobs in the Sunbelt, while rising insurance and disaster costs in states like Florida and Louisiana act as a permanent tax on the poor, making upward mobility almost impossible.