NEW DELHI, INDIA (IST)
00:00:00 PM
|
Loading...
DETECTING LOCATION...
00:00:00 PM
|
Loading...
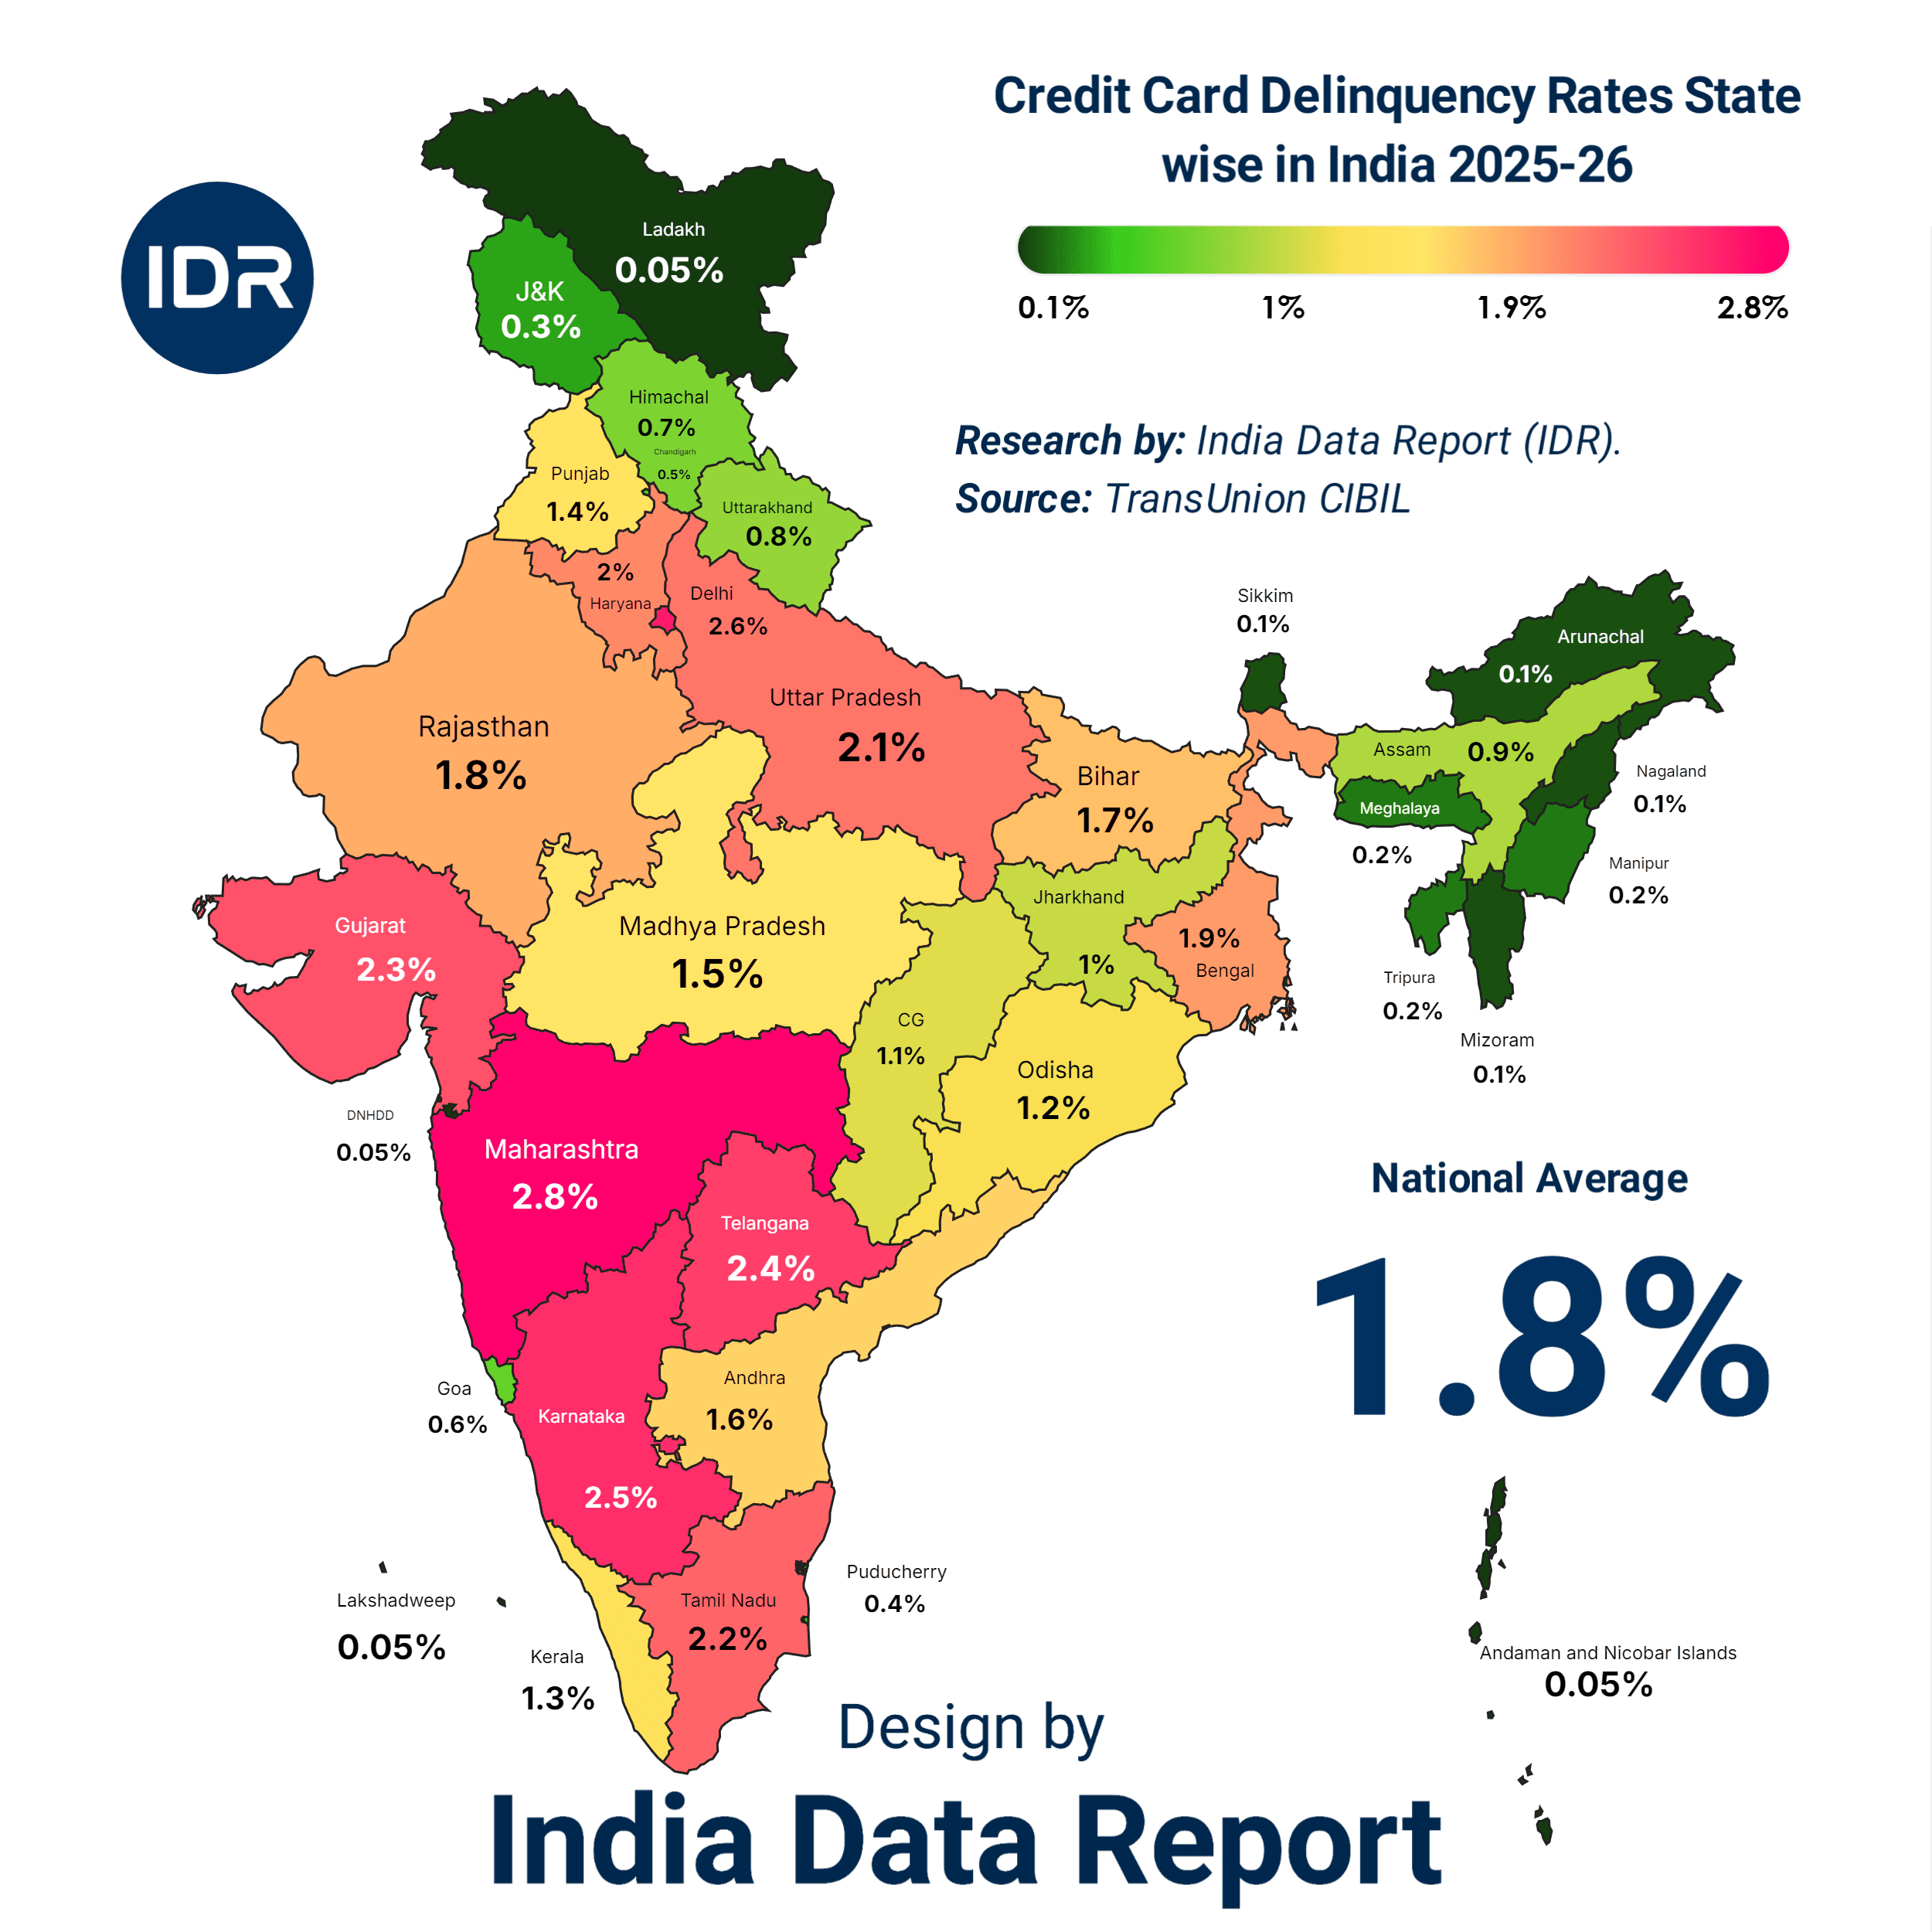
| S.N. | State / UT | Delinquency Rate (%) |
|---|---|---|
| 1 | Maharashtra | 2.8% |
| 2 | Karnataka | 2.5% |
| 3 | Telangana | 2.4% |
| 4 | Gujarat | 2.3% |
| 5 | Tamil Nadu | 2.2% |
| 6 | Uttar Pradesh | 2.1% |
| 7 | Haryana | 2.0% |
| 8 | West Bengal | 1.9% |
| 9 | Rajasthan | 1.8% |
| 10 | Bihar | 1.7% |
| 11 | Andhra Pradesh | 1.6% |
| 12 | Madhya Pradesh | 1.5% |
| 13 | Punjab | 1.4% |
| 14 | Kerala | 1.3% |
| 15 | Odisha | 1.2% |
| 16 | Chhattisgarh | 1.1% |
| 17 | Jharkhand | 1.0% |
| 18 | Assam | 0.9% |
| 19 | Uttarakhand | 0.8% |
| 20 | Himachal Pradesh | 0.7% |
| 21 | Goa | 0.6% |
| 22 | Delhi | 2.6% |
| 23 | Puducherry | 0.4% |
| 24 | Jammu & Kashmir | 0.3% |
| 25 | Meghalaya | 0.2% |
| 26 | Manipur | 0.2% |
| 27 | Tripura | 0.2% |
| 28 | Sikkim | 0.1% |
| 29 | Arunachal Pradesh | 0.1% |
| 30 | Nagaland | 0.1% |
| 31 | Mizoram | 0.1% |
| 32 | Ladakh | 0.05% |
| 33 | Dadra & Nagar Haveli and Daman & Diu (DNHDD) | 0.05% |
| 34 | Lakshadweep | 0.05% |
| 35 | Andaman & Nicobar Islands | 0.05% |
National Average Delinquency Rate: 1.8%
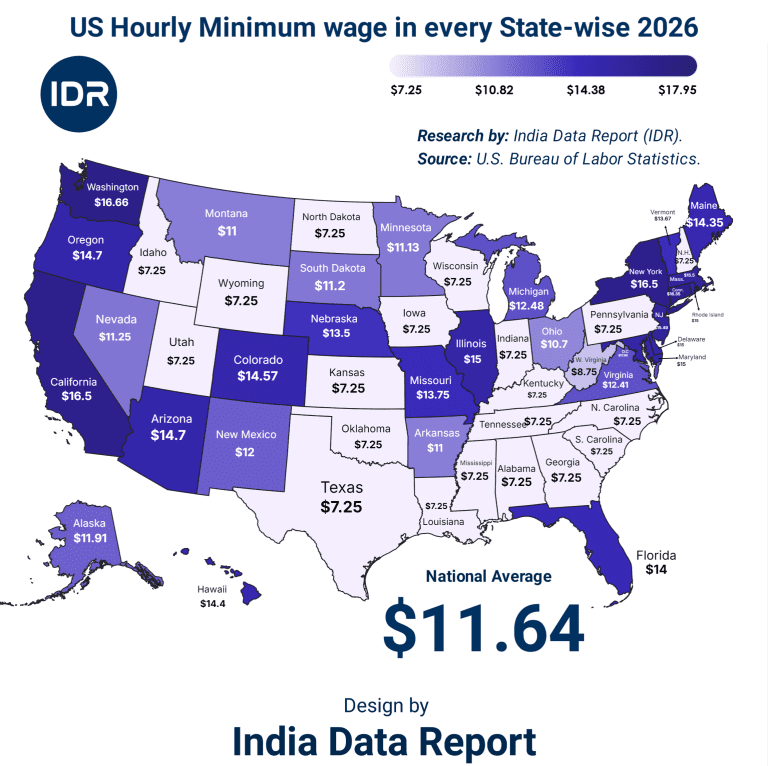
The glitter of Mumbai’s skyline and the glass-fronted tech parks of Bengaluru have a dirty secret. It’s not buried in spreadsheets; it’s screaming from the unpaid bills of millions. We’ve been sold a dream of “frictionless credit,” but look closely at the 2025–26 data, and you’ll see the friction is finally burning the engine out. We aren’t just spending money we don’t have; we are cannibalizing our future stability for the dopamine hit of an EMI-funded lifestyle.
For years, the narrative was about “financial inclusion.” The suits in Mumbai’s BKC told us that putting a credit card in every pocket was progress. They lied. Or perhaps, they just didn’t care about the consequences as long as the processing fees kept rolling in. Today, the national delinquency average sits at 1.8%, a number that looks deceptively calm until you realize it’s being dragged up by the very states we call the “engines of growth.” When Maharashtra and Karnataka start bleeding, the whole country catches a fever.
We are witnessing a psychological collapse disguised as a financial trend. The urban Indian is trapped in a vicious cycle of “keeping up with the Kapoors,” fueled by aggressive algorithms that know your spending triggers better than you do. You think you’re in control? Ask the 2.8% in Maharashtra who are currently underwater. These aren’t just numbers; these are families staring at recovery agents, professionals losing sleep over a rotating credit trap, and a middle class that is one paycheck away from total insolvency.
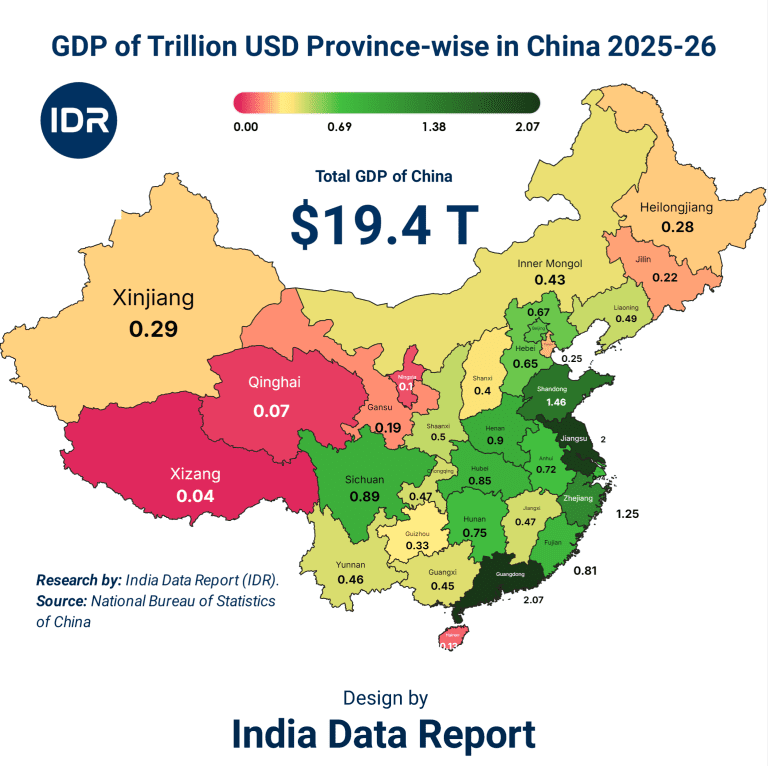
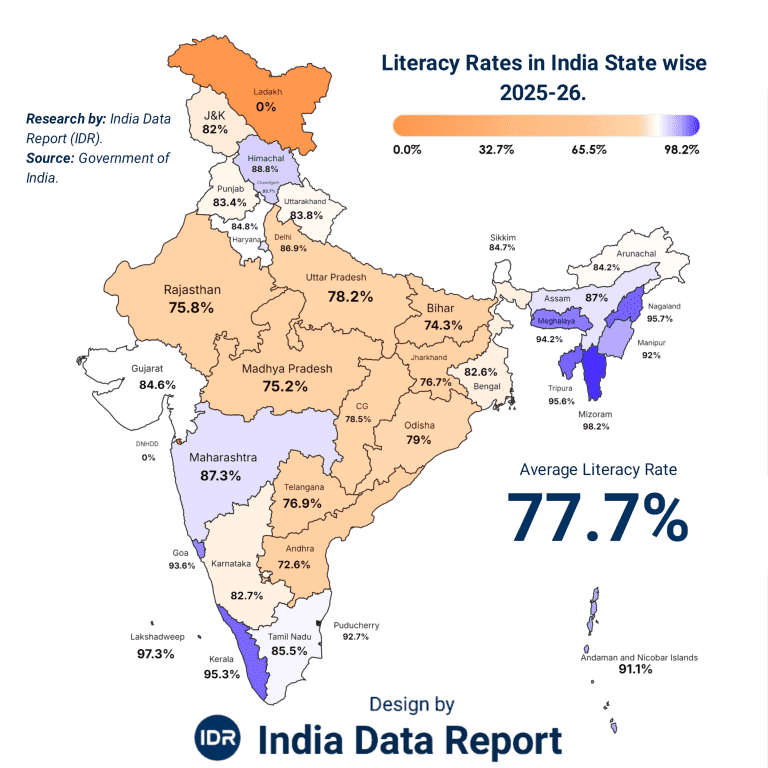
The irony is thick enough to choke on. The states with the highest literacy and highest GDP are the ones failing the basic test of financial discipline. Meanwhile, the so-called “backward” states like Bihar and Jharkhand are showing the big cities how to actually manage a balance sheet. It’s a slap in the face of the elitist economic theory that suggests wealth equals financial wisdom. In reality, wealth in our metros has become a synonym for leverage.
| State / UT | Delinquency Rate (%) | Economic Status | Debt Sentiment |
| Maharashtra | 2.8% | Industrial Leader | Critical / Overleveraged |
| Delhi | 2.6% | Administrative Hub | High-Stress Consumption |
| Karnataka | 2.5% | Tech Capital | Lifestyle Inflation Trap |
| Telangana | 2.4% | Emerging Tech Hub | Aggressive Borrowing |
| Gujarat | 2.3% | Trading Giant | Speculative Defaults |
The Bitter Truth: High GDP is no longer a sign of health; it’s a sign of how much debt a population can sustain before the snapping point. Maharashtra isn’t leading; it’s crashing.
Why is Maharashtra at 2.8%? Because Mumbai is the capital of vanity. When your rent eats 50% of your income and your social circle demands a 100% lifestyle, the credit card becomes a survival tool rather than a financial instrument. People are using Card A to pay the minimum due on Card B. It’s a Ponzi scheme where the participant is both the victim and the perpetrator.
Banks have been complicit. They’ve hunted “New-to-Credit” (NTC) customers with the predatory zeal of a shark in bloody water. They looked at the soaring aspirations of the youth and saw a revenue stream, ignoring the fact that salary growth hasn’t kept pace with the cost of urban living. The result? A generation that owns the latest iPhone but doesn’t own their own future.
| State / UT | Delinquency Rate (%) | Key Driver | Financial Behavior |
| Kerala | 1.3% | Remittance Economy | Savings-First Approach |
| Odisha | 1.2% | Resource Based | Conservative Spending |
| Himachal Pradesh | 0.7% | Agrarian/Tourism | Low Credit Penetration |
| Sikkim | 0.1% | Community Based | High Accountability |
| Ladakh | 0.05% | Isolated/Traditional | Zero-Debt Culture |
Golden Opportunity: There is an untapped, disciplined market in the “Low Delinquency” belt. The future of sustainable banking isn’t in the flashy malls of Gurgaon; it’s in the grit of the Northeast and the hills.
We are told the economy is “resilient.” But resilience built on 22% interest rates is a fantasy. When you look at the delinquency rates of Karnataka (2.5%) and Telangana (2.4%), you are looking at the burnout of the Indian techie. The “hustle culture” promised them the world but gave them a mountain of plastic debt. They are working 14-hour days not to build a legacy, but to keep the collection bots at bay.
The psychological toll is immense. We see a rise in “financial anxiety” which leads to even poorer decision-making. A man who owes three lakhs on a card is more likely to take a high-interest personal loan to “consolidate,” only to find himself in a deeper hole six months later. The system is designed to keep you on the treadmill, and currently, the treadmill is set to a speed that is starting to break bones.
Is this the India we wanted? A country where the richest states are the most financially fragile? This isn’t just an economic report; it’s a diagnostic of a national sickness. We are trading our peace of mind for plastic chips, and the house—as always—is winning.
The data doesn’t just tell us who is failing to pay; it reveals a profound cultural schism in how India perceives money. For decades, the “South Indian Model” was hailed as the gold standard—high literacy, high GDP, and a booming service sector. But look at the numbers again. Karnataka (2.5%) and Telangana (2.4%) are bleeding red, while Bihar (1.7%) and Uttar Pradesh (2.1%)—despite their massive populations and lower per-capita income—are showing a grit that the “Silicon Valleys” of India lack.
This is the “Consumption Trap.” In Bengaluru and Hyderabad, credit has become a social currency. If you aren’t swiping, you aren’t living. The psychological pressure to project a “Global Indian” persona has forced the middle class into a corner. Meanwhile, in the Hindi heartland, there remains a deep-seated, almost ancestral fear of debt (Karz). In the North, debt is still seen as a mark of shame; in the urban South, it’s seen as a “financial tool.” The 2025–26 data suggests that the “tool” has turned into a weapon, and it’s pointed straight at the heart of the southern economy.
| Region | Avg. Literacy (%) | Avg. Delinquency (%) | The Verdict |
| South (KA, TN, TL) | High (80%+) | 2.36% | High IQ, Low Financial EQ |
| North (UP, RJ, HR) | Moderate (65-75%) | 1.96% | Cultural Debt-Aversion |
| East (OR, JH, WB) | Moderate (70%+) | 1.36% | Survivalist Savings |
The Bitter Truth: Degrees don’t pay bills. The most “educated” states are currently the most irresponsible with their plastic.
Why is Haryana at 2.0% while Delhi is at 2.6%? They share a border, but they don’t share a mindset. Delhi is the epicenter of “Show-off Culture.” It is a city that eats its young. The 2.6% delinquency rate in the capital isn’t just about job losses; it’s about a refusal to downsize. People would rather default on a credit card than move to a smaller apartment or sell a car they can no longer afford.
We are seeing a phenomenon I call “Ghost Wealth.” On paper, the urban Indian is rich. They have assets, high-paying jobs, and premium cards. In reality, they are hollow. The growth of fintech apps has made borrowing as easy as ordering a pizza. “Buy Now, Pay Later” (BNPL) has acted as a gateway drug, leading users from small 5,000-rupee lapses to massive credit card defaults. The barrier to entry is gone, and with it, the survival instinct that used to keep the Indian household safe.
| State | Delinquency Rate (%) | The “Secret Sauce” |
| Rajasthan | 1.8% | Strong Community Lending Networks |
| Madhya Pradesh | 1.5% | Lower Cost of Living vs. Income |
| Jharkhand | 1.0% | Distrust of Formal Credit Systems |
| Assam | 0.9% | Cash-Heavy Local Economies |
Golden Opportunity: For banks, the “Northeast and East” aren’t just regions; they are fortresses of fiscal discipline. A pivot toward these markets could save their balance sheets.
Let’s be blunt: The banks knew this was coming. Their models predicted that as interest rates remained high through 2025, the “marginal borrower”—the guy with a 40,000-rupee salary and a 1-lakh credit limit—would eventually snap. But they kept pushing the cards. Why? Because the late fees and the 40% annual interest rates are more profitable than a customer who pays on time.
The delinquency in Gujarat (2.3%) is particularly alarming. This is a state of entrepreneurs and traders. When the traders stop paying their personal credit card bills, it means the underlying cash flow of the small-business economy is drying up. They are using personal credit to fund business liquidity—a desperate move that usually ends in a total crash. We aren’t just looking at a few “bad apples”; we are looking at an entire orchard that has been over-fertilized with cheap debt and is now rotting from the roots.
What we are witnessing is the death of “The Great Indian Saving Grace.” We used to be a nation of savers. Now, we are a nation of “Subscribers”—subscribing to a life we haven’t earned. The 1.8% national average is the smoke; the fire is in the skyscrapers of our most “developed” cities.
Behind every decimal point in the 2.8% delinquency rate of Maharashtra lies a human being who is slowly coming apart at the seams. We talk about “macroeconomics” as if it’s a game of chess played on a mahogany table, but for the millions trapped in the credit card vortex, it’s a street fight for their dignity. We have moved from a society that feared debt to one that is consumed by it, and the transition has been nothing short of violent.
The modern Indian borrower is being hunted by two monsters: the “Shadow of Status” and the “Algorithm of Harassment.” In cities like Bengaluru (part of Karnataka’s 2.5% disaster), the pressure to maintain a certain aesthetic on social media has created a new class of “Working Poor.” They earn six-figure salaries but live in “Financial Handcuffs.” They swipe for the organic grocery bill, they swipe for the weekend getaway, and they swipe because the alternative—admitting they are broke—is a social death sentence.
| Delinquency Bracket | Typical State | Primary Psychological Impact | Social Consequence |
| > 2.5% (High) | Maharashtra, Delhi | Chronic Anxiety & Burnout | Isolation / Social Withdrawal |
| 1.5% – 2.5% (Mid) | Uttar Pradesh, Gujarat | Sleeplessness / Stress | Strained Family Relations |
| < 1.0% (Low) | Goa, Himachal | Financial Peace / Security | High Community Trust |
The Bitter Truth: A credit card doesn’t just buy goods; it buys a temporary escape from reality. When the bill arrives, reality returns with a vengeance that many aren’t equipped to handle.
Gone are the days when a polite (or even a rude) human called you to remind you of a payment. In 2026, the banks have unleashed “Recovery Bots.” These are AI-driven systems that analyze your psychological profile to determine the best time to call you—usually when you are most vulnerable. They send automated legal threats that look terrifyingly official, designed to trigger the “Fight or Flight” response.
This is the dark side of “Digital India.” The same technology that was supposed to empower the citizen is now being used to psychologically dismantle the defaulter. In Telangana (2.4%), we are seeing a spike in mental health crises directly linked to digital lending harassment. The “frictionless” credit has become a “frictionless” nightmare. Banks are no longer partners in your growth; they are spectators of your downfall, waiting to pick the bones clean with “restructuring fees” that only deepen the hole.
| State / UT | Delinquency Rate (%) | Banking Penetration | The “Human” Factor |
| Goa | 0.6% | High | Strong Local Reputation Risk |
| Puducherry | 0.4% | Moderate | High Accountability |
| Meghalaya | 0.2% | Low | Matrilineal Financial Control |
| Manipur | 0.2% | Low | Survivalist Cash Economy |
Golden Opportunity: The resilience of the Northeast (Manipur/Meghalaya at 0.2%) proves that community-based financial discipline is infinitely more stable than algorithm-based “Global Banking.”
The most dangerous trend revealed by this state-wise ranking is the total evaporation of the “Rainy Day” fund. In the past, an Indian household would have gold or a fixed deposit to lean on. Today, the credit card is the emergency fund. When Tamil Nadu (2.2%) shows a delinquency rate higher than the national average, it tells us that even the traditionally conservative South Indian middle class has abandoned its safety net.
We are living in an era of “Immediate Gratification, Infinite Debt.” The concept of saving up to buy something is considered “primitive.” But as the 1.8% national average creeps upward, the “primitive” way is looking more like a survival strategy. We are witnessing the collapse of financial character. When you can’t pay your credit card bill, you lose more than just a CIBIL score; you lose the ability to dream about the future because you are too busy surviving the past.
Is the “Modern Indian” just a fancy term for a “Sophisticated Defaulter”? The data suggests we are dangerously close to that reality. We have built an empire on plastic, and it’s starting to melt under the heat of 18% inflation and stagnant wages.
Let’s stop blaming the victim for a moment. Yes, the individual swiped the card, but who sharpened the blade? The 1.8% national delinquency rate isn’t a freak accident; it’s a design feature. We are currently navigating a landscape where the Reserve Bank of India (RBI) is trying to play the “strict parent” while the commercial banks are acting like “enabling pushers.” The systemic failure here is that we’ve prioritized “Credit Growth” over “Economic Health,” and now the bill is coming due in the most aggressive way possible.
In states like Uttar Pradesh (2.1%) and Rajasthan (1.8%), we see the collision of traditional aspirations with predatory fintech. These aren’t just “bank” cards; these are “embedded finance” traps hidden inside shopping apps, travel portals, and even food delivery platforms. The system has made it harder to not borrow than to borrow. They’ve removed the “pain of paying” and replaced it with a digital high, and the result is a systemic rot that is being swept under the rug of “restructured assets.”
| Institution Type | Market Share Growth | Delinquency Contribution | Strategy |
| Private Banks | Massive | High | “Pre-Approved” Traps |
| Fintech/NBFCs | Explosive | Critical | High-Interest “Nano” Loans |
| Public Sector Banks | Moderate | Stable | Conservative / Lagging |
| Co-operative Banks | Declining | Low | Community Relationship |
The Bitter Truth: “Pre-approved” is just a polite way of saying “We’ve profiled you as someone likely to pay interest for the next ten years.”
The official numbers tell us Maharashtra is at 2.8%, but if we look at “soft defaults”—people who are barely paying the minimum due by taking personal loans from other apps—the real number would likely double. The banking sector is playing a dangerous game of “Evergreening.” They offer a “Top-up Loan” to a struggling credit card holder to pay off their card balance, moving the debt from one column to another. It’s a financial shell game.
This is why West Bengal (1.9%) and Andhra Pradesh (1.6%) are so interesting. These states have a history of microfinance crises. They’ve seen what happens when debt cycles spin out of control. Yet, the formal banking sector is repeating the same mistakes of the 2010 MFI crisis, just with better apps and shinier plastic. They are lending to the “aspirational class” without checking if that aspiration has a foundation of actual income.
| State Cluster | Avg. Interest Rate (APR) | Delinquency Impact | Result |
| Tier 1 (MH, KA, DL) | 38% – 42% | Heavy | The Debt Trap |
| Tier 2 (UP, MP, BR) | 40% – 45% | Moderate | The Survival Struggle |
| Tier 3 (NE States) | 30% – 36% | Negligible | The Disciplined Minority |
Golden Opportunity: A regulatory “hard cap” on credit card APR could save millions from insolvency, but don’t hold your breath—the lobbies are too strong.
We are told that India is the “bright spot” in the global economy. But a bright spot fueled by unsecured credit is just a fire waiting for a breeze. When you see Tamil Nadu at 2.2%, you are seeing the failure of the industrial middle class. If the people who make our cars and stitch our clothes are defaulting on their cards, who exactly is the “booming economy” for?
The banks have weaponized “Data Science” to exploit human weakness. They know that a person in Haryana (2.0%) is likely to spend more on “Lifestyle/Status” during the wedding season, so they pump out “Limit Increase” notifications exactly at that time. It’s not service; it’s predatory psychology. We’ve turned our banking system into a casino where the house knows your pulse rate, your GPS location, and your deepest insecurities.
The systemic failure isn’t just about bad loans; it’s about the death of financial ethics. We have built a machine that thrives on the “Minimum Due” payment—a mathematical trap designed to keep the Indian worker in a state of perpetual debt-servitude.
We have reached the end of the line. The data from 2025–26 isn’t just a spreadsheet; it’s a suicide note for the “unregulated consumption” era. If we continue at this pace, the national delinquency average won’t stay at 1.8%—it will touch 4% by 2028, triggering a systemic freeze that will make the 2008 Lehman crisis look like a minor glitch in a video game.
The “Plastic Raj” is reaching its tipping point. We’ve seen the giants of Maharashtra (2.8%) and Delhi (2.6%) falter, proving that urban sprawl is a breeding ground for financial fragility. The future of India isn’t going to be decided by who has the highest credit limit, but by who has the most “Debt-Free Freedom.” The next four years will be a brutal filtration process where the “Aspirationals” are separated from the “Sustainables.”
| Period | Predicted Delinquency | Key Driver | Likely Outcome |
| 2026-27 | 2.2% – 2.5% | Tech-Sector Stagnation | Massive “Credit Limit” Slashes |
| 2028 | 3.0% (The Peak) | Interest Rate Fatigue | Collapse of Mid-tier Fintechs |
| 2029 | 2.5% (Correction) | Regulatory “Hard Caps” | Return to Conservative Banking |
| 2030 | 1.5% (New Normal) | Digital Rupee (CBDC) | End of the “Minimum Due” Trap |
The Bitter Truth: By 2030, a “High CIBIL Score” will be harder to maintain than a Gold Medal. The era of easy plastic is dying.
As an Investigative Journalist who has seen the guts of this industry, here is my forecast: The glamour of the credit card will fade. By 2030, the most “status-heavy” thing you can do is pay in full, upfront. We are already seeing the first signs of a “Debt-Rejection Movement” in the younger Gen-Z workforce—those who saw their parents struggle in the 2.8% Maharashtra trap.
The government will eventually be forced to step in. The “Helpful Content” and “Helpful Finance” policies aren’t just for Google; they are the future of governance. Expect a “Financial Health Tax” on banks that have more than 3% delinquency in any single state. The party is over, and the lights are about to be turned on.
| Step | Action | Why? |
| 1 | Kill the “Multiple Card” Game | Algorithms exploit your complexity. |
| 2 | The “72-Hour” Rule | Wait 72 hours before any credit purchase. |
| 3 | Move to Tier 2/3 Mentalities | Adopt the Bihar/Jharkhand “Need vs. Want” filter. |
| 4 | Build a “Plastic-Free” Buffer | 6 months of expenses in a liquid fund. |
Golden Opportunity: The first generation to break the credit cycle will be the one that owns the real estate and assets of the future. While others pay interest, you will be earning it.
Is the 1.8% national average a warning or a death knell? That depends on you. If you are sitting in a high-rise in Gurgaon or a tech park in Whitefield, look at your wallet. That piece of plastic is either a bridge to your future or a weight around your neck. The data for Jammu & Kashmir (0.3%) and Sikkim (0.1%) tells us that peace of mind is possible even with less “modern” infrastructure.
We don’t need more credit; we need more character. We don’t need higher limits; we need higher standards for what we consider “success.” The Great Plastic Hemorrhage can be stopped, but it requires the courage to say, “I can’t afford it.” In a world of 2.8% defaults, that is the most powerful sentence you can utter.
The bubble will burst in late 2027. If you aren’t debt-free by then, you are the fuel for the fire. Choose wisely.
It’s the “Vanity Trap.” Maharashtra, specifically Mumbai, has the highest cost of living and the highest pressure for social signaling. People are using credit cards to fund a lifestyle their salaries can’t sustain, leading to a dangerous cycle of “rolling debt” that is now starting to snap.
On paper, it looks manageable. In reality, it’s a “leaking pipe” in a skyscraper. Because this debt is unsecured, banks have no collateral to grab. When the “engines of growth” like Karnataka and Delhi cross 2.5%, it indicates that the most productive part of our workforce is financially suffocating.
Cultural resilience. In states like Bihar (1.7%) and Jharkhand (1.0%), debt is still viewed as a social stigma (Lajja). These regions rely more on cash and community lending, avoiding the “algorithmic traps” that lure urban dwellers into over-spending.
No. A “Pre-approved” offer isn’t a reward; it’s a trap based on your data profile. Banks use these to target individuals who show signs of “revolving credit” behavior, knowing they can extract 30-40% interest annually from you for years.
Follow the “Power of One” rule: Keep one card for emergencies, kill the rest. Transition to UPI or Debit for daily needs to re-establish the “pain of paying.” If you can’t pay the full balance every month, you aren’t a “user”—you’re a “product” being sold by the bank.