NEW DELHI, INDIA (IST)
00:00:00 PM
|
Loading...
DETECTING LOCATION...
00:00:00 PM
|
Loading...
| S.N. | State | Renewable Share (%) |
|---|---|---|
| 1 | Washington | 75 |
| 2 | Iowa | 60 |
| 3 | Oregon | 55 |
| 4 | Idaho | 50 |
| 5 | South Dakota | 48 |
| 6 | California | 45 |
| 7 | Nevada | 42 |
| 8 | North Dakota | 38 |
| 9 | Kansas | 35 |
| 10 | New York | 34 |
| 11 | Minnesota | 32 |
| 12 | Oklahoma | 30 |
| 13 | Texas | 28 |
| 14 | Illinois | 27 |
| 15 | Colorado | 26 |
| 16 | Hawaii | 21 |
| 17 | Arizona | 20 |
| 18 | Maine | 19 |
| 19 | Wisconsin | 18 |
| 20 | New Mexico | 17 |
| 21 | Montana | 16 |
| 22 | Ohio | 15 |
| 23 | Pennsylvania | 15 |
| 24 | South Carolina | 15 |
| 25 | Georgia | 7 |
| 26 | Missouri | 5 |
| 27 | Louisiana | 4 |
| 28 | Alabama | 3 |
| 29 | Tennessee | 2 |
| 30 | Florida | 1 |
| 31 | Arkansas | 0.7 |
| 32 | Nebraska | 0.6 |
| 33 | North Carolina | 0.5 |
| 34 | Alaska | 0.5 |
| 35 | Mississippi | 0.5 |
| 36 | Utah | 0.2 |
| 37 | Kentucky | 0 |
| 38 | Wyoming | 0 |
| 39 | Virginia | 0 |
| 40 | West Virginia | 0 |
| 41 | Indiana | 0 |
| 42 | Michigan | 0 |
| 43 | New Jersey | 0 |
| 44 | Delaware | 0 |
| 45 | Maryland | 0 |
| 46 | Connecticut | 0 |
| 47 | Rhode Island | 0 |
| 48 | Massachusetts | 0 |
| 49 | Vermont | 0 |
| 50 | New Hampshire | 0 |
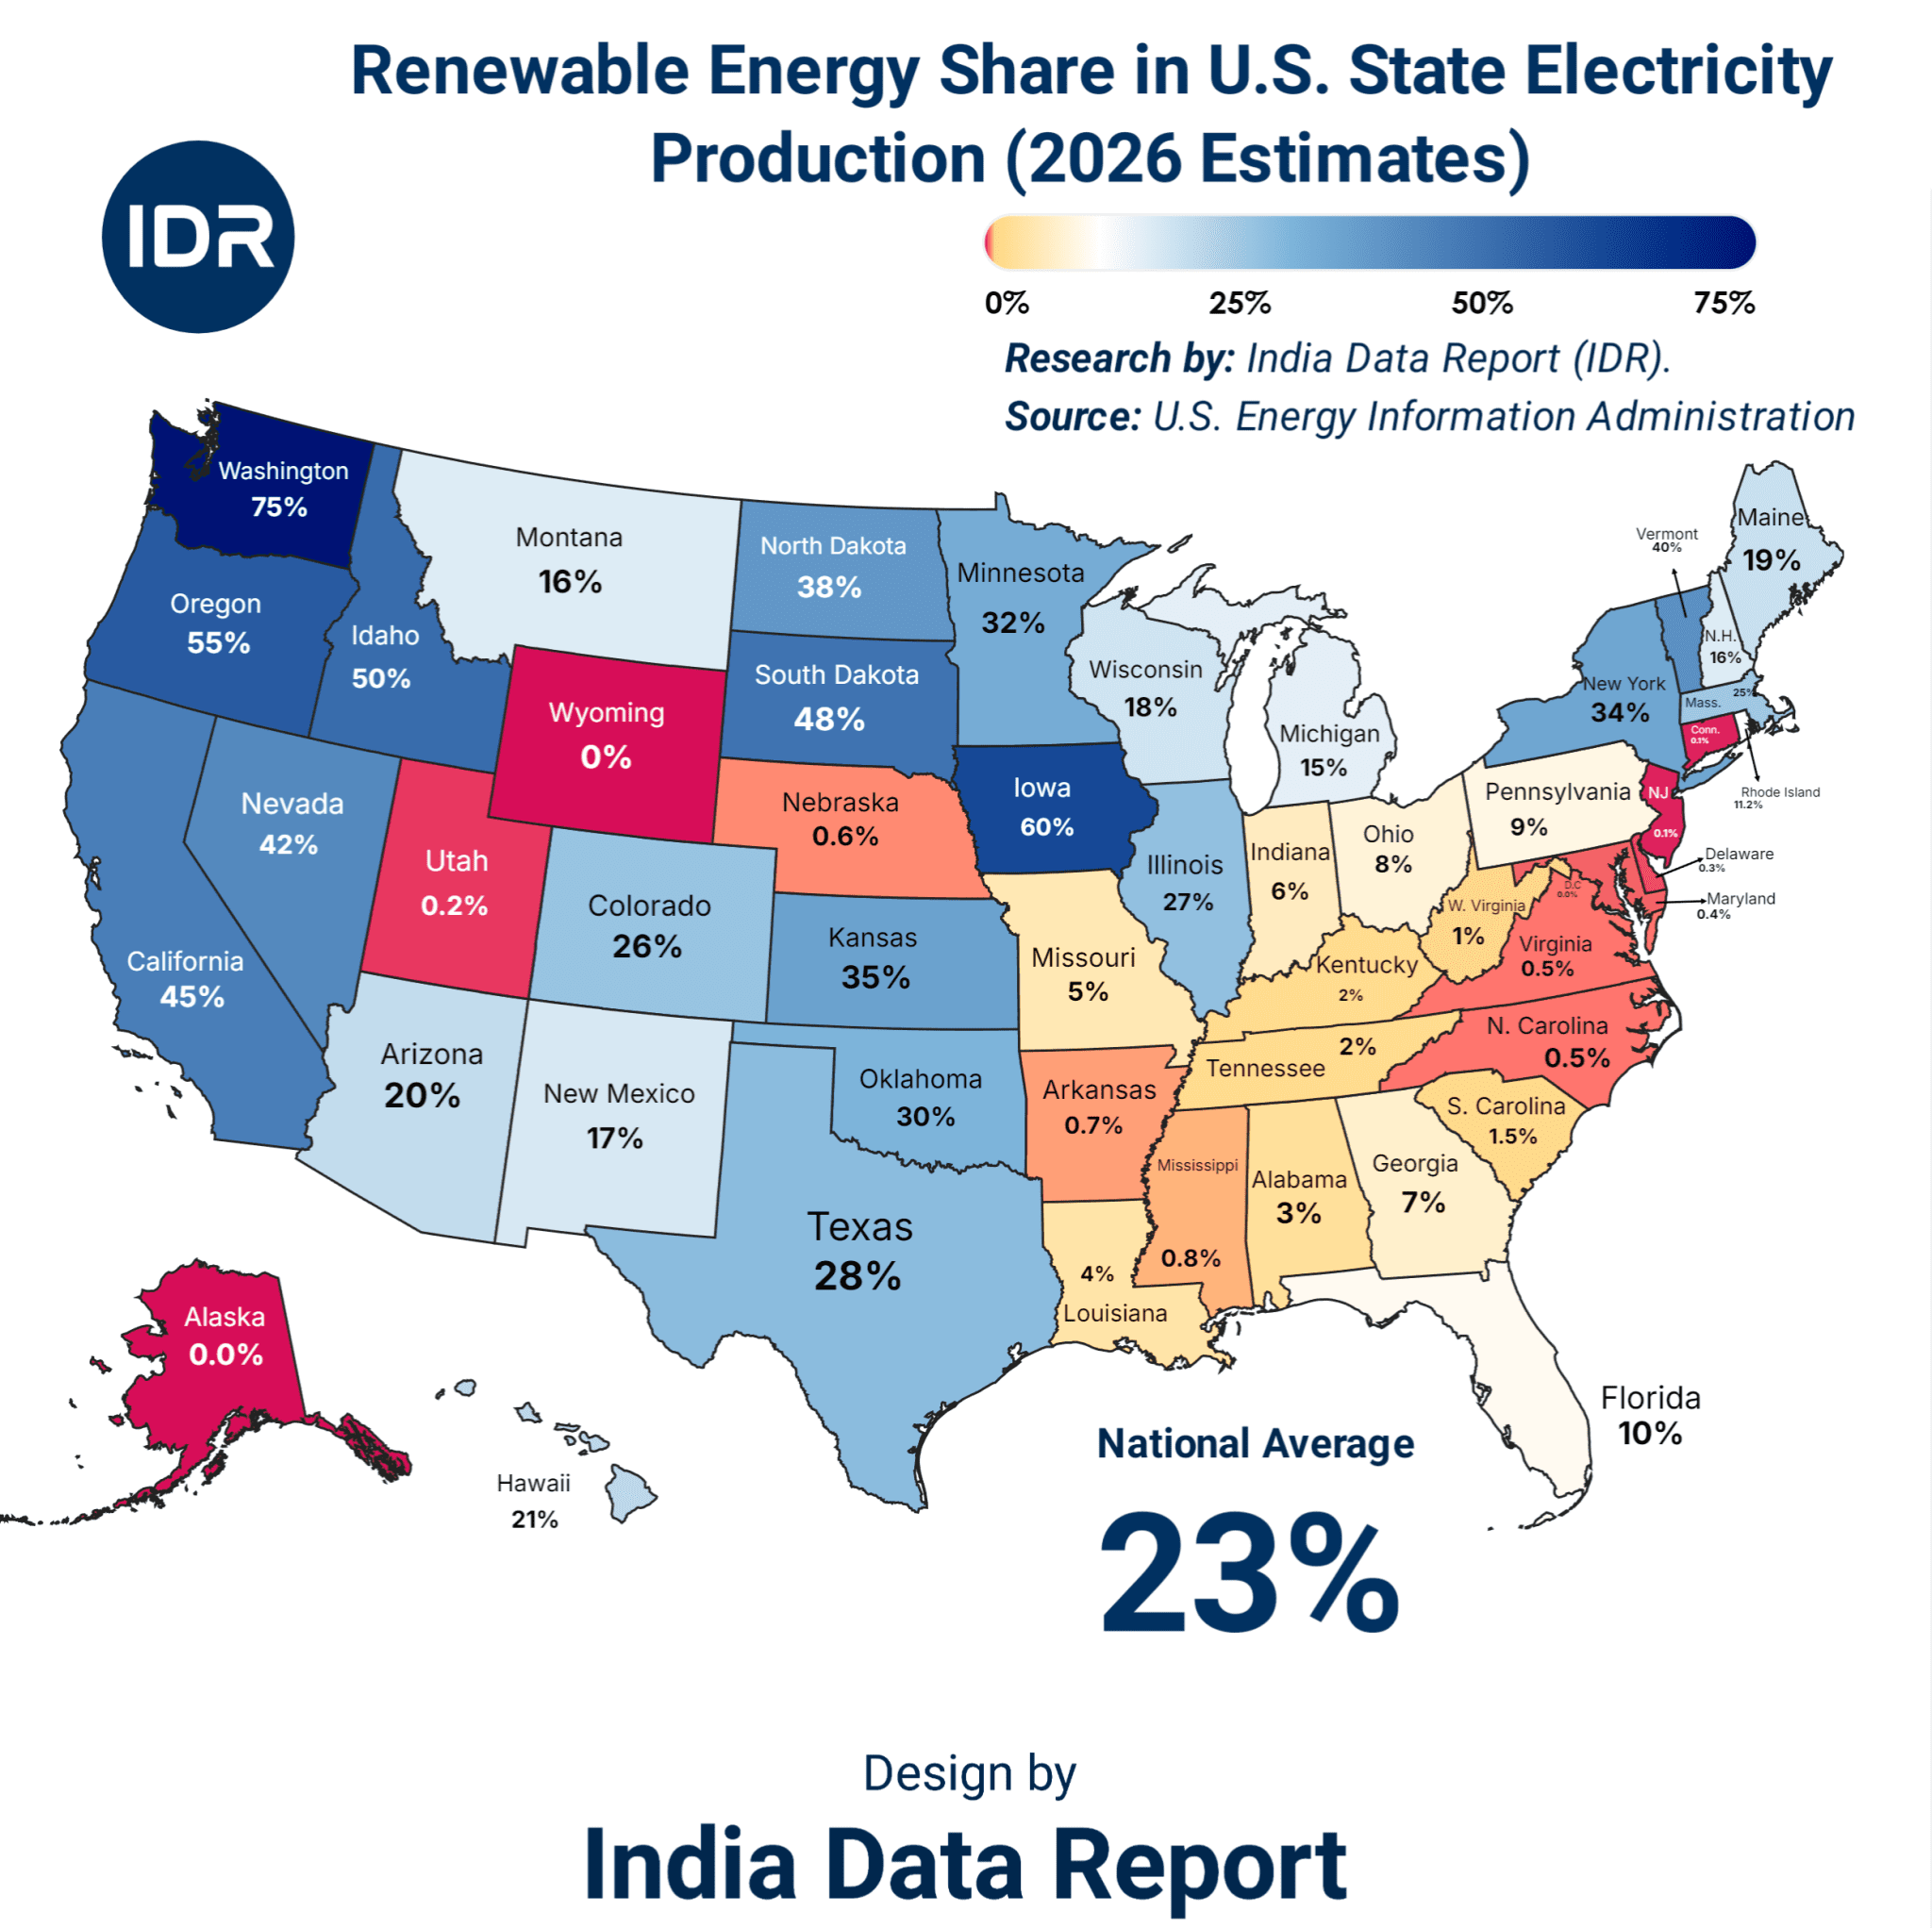
The American green energy revolution is a mathematical fiction. For years, Washington has sold the world a pristine, lithium-powered dream of a decarbonized future. But if you pull back the glossy public relations curtains and look at the hard, cold state-level data for 2026, the reality is not just disappointing—it is dangerously fractured. We are witnessing an economic and infrastructural civil war disguised as a climate transition. While a handful of states are drowning in hydro and wind energy, a massive, stubborn chunk of the American industrial heartland is flatlining at absolute zero.
The national average of 23% renewable energy share is a classic statistical trap. It is the economic equivalent of placing one hand in an oven and the other in a freezer and claiming that, on average, your body temperature is perfectly comfortable. This isn’t a transition; it is a profound systemic failure that threatens to derail the global economy, destabilize the U.S. power grid, and leave millions of ordinary citizens holding the bill for trillions of dollars in misallocated capital.
Let’s stop pretending all renewable energy is created equal. The states sitting at the top of the leaderboard aren’t there because of recent policy brilliance or sudden ecological enlightenment. They are there because of geographic lottery tickets punched nearly a century ago. Washington State leads the nation at an enviable 75% renewable share. Why? Because of the massive, concrete legacy of the Federal Columbia River Power System. It is hydro-power—built by grandfathers with dynamite and taxpayer money in the mid-20th century—not modern solar panels or wind turbines paid for by venture capitalists.
Move east into Iowa (60%) and South Dakota (48%), and you find the wind belt. On paper, these numbers look spectacular. Wall Street loves to use these states as poster children for the “inevitable” green transition. But look at what happens behind the scenes.
When the wind blows furiously in the middle of the night in Iowa, electricity prices regularly drop into negative territory. The state produces power it cannot consume and cannot efficiently export because the interstate transmission grid is an archaic, bureaucratic mess. It is a feast-or-famine economic model that destroys market pricing mechanisms while keeping fossil-fuel plants on expensive life-support systems just to handle the evening peak when the wind dies down.
| State | Renewable Share (%) | Primary Driver / Structural Bottleneck |
| Washington | 75% | Historical Hydro Dominance / Grid Isolation |
| Iowa | 60% | Wind Surplus / Interconnection Choke Points |
| Oregon | 55% | Columbia River Basin Hydro / Seasonal Vulnerability |
| Idaho | 50% | Hydro & Geothermal Assets / Low Industrial Demand |
| South Dakota | 48% | Wind Corridor Concentration / Minimal Local Consumption |
| California | 45% | Aggressive Solar Subsidies / The “Duck Curve” Crisis |
| Nevada | 42% | Geothermal & Utility Solar / High Land Storage Costs |
| North Dakota | 38% | Wind Expansion / Co-existence with Coal Lobby |
| Kansas | 35% | Plains Wind / Lack of Cross-Border High-Voltage Lines |
| New York | 34% | Upstate Hydro & Offshore Wind Promises / Downstate Fossil Reliance |
(The Bitter Truth): Top-tier states are bloating their statistics using legacy geography and heavily subsidized wind infrastructure that the current interstate grid cannot redistribute. It creates a false sense of national progress while masking deep structural vulnerabilities.
Now look at the bottom of the ledger. This is where the hype of the green transition hits the brick wall of reality. Kentucky, Wyoming, Virginia, West Virginia, Indiana, Michigan, New Jersey, Delaware, Maryland, Connecticut, Rhode Island, Massachusetts, Vermont, and New Hampshire are all sitting at a staggering, absolute 0%.
Let that sink in. Nearly a third of the United States of America is contributing nothing to the renewable energy matrix.
[Washington: 75%] ███████████████████████████████
[National Avg: 23%] ███████▉
[14 States: 0%]
How does a hyper-industrialized state like Michigan or a financial powerhouse like New Jersey register a zero? It comes down to political capture, regulatory inertia, and the sheer physical limitations of the local geography. The traditional industrial states cannot run automotive assembly lines or chemical manufacturing plants on intermittent solar arrays or coastal breezes that face ten-year environmental review delays before a single blade can turn.
The political economy of these zero-percent states is a masterclass in survival psychology. In places like West Virginia and Kentucky, coal and natural gas aren’t just energy sources; they are the bedrock of local employment, tax bases, and cultural identity. Asking these regions to abandon their baseload assets without an economically viable, dispatchable alternative isn’t just bad economics—it’s political suicide for local leaders.
Consequently, we see a massive capital flight. Trillions of dollars allocated via federal climate bills are flowing into states that already have high renewable penetration, leaving the zero-percent states further behind, locked into aging fossil-fuel infrastructure that becomes more expensive to maintain by the day.
The true battlefield of this transition lies in the middle tier—states like Texas (28%), Illinois (27%), and Ohio (15%). These are the economic engines of the country, where the tension between green mandates and industrial survival is reaching a boiling point.
Take Texas. At 28%, it actually generates more total megawatt-hours of renewable energy than almost any other state due to its sheer size. Yet, the Texas grid (ERCOT) remains a volatile, isolated island. The state’s political leadership loves the revenue from West Texas wind and solar, but refuses to mandate the grid connections to the rest of the country. This creates a bizarre paradox where Texas can experience localized power gluts while its major metropolitan areas face rolling blackouts during extreme winter freezes or summer heatwaves.
| State | Renewable Share (%) | Economic Implications |
| Minnesota | 32% | Balancing wind integration with brutal winter heating demands. |
| Oklahoma | 30% | Wind wealth co-existing with deep oil and gas legacy. |
| Texas | 28% | Massive absolute generation but crippled by grid isolation (ERCOT). |
| Illinois | 27% | Nuclear baseline dominance keeping renewables in a secondary role. |
| Colorado | 26% | Rapid coal retirements causing localized grid stability anxiety. |
| Hawaii | 21% | High isolated costs; dependent on expensive imported fuel alternatives. |
| Arizona | 20% | Underutilized solar potential due to utility regulatory battles. |
| Maine | 19% | Localized biomass and wind facing heavy conservationist pushback. |
| Wisconsin | 18% | Manufacturing sector wary of increasing industrial electricity tariffs. |
| New Mexico | 17% | Solar-rich but hampered by slow transmission build-outs to major markets. |
| Montana | 16% | Coal extraction legacy capping wind development potential. |
| Ohio | 15% | Industrial heartland refusing to sacrifice baseload security for wind. |
| Pennsylvania | 15% | Fracking boom in Marcellus Shale crowding out renewable investment. |
| South Carolina | 15% | Heavy reliance on nuclear power leaving little room for green mandates. |
The human cost of this misaligned transition is borne by the ratepayer. In states that aggressively push renewable quotas without upgrading their transmission networks, utility companies pass the multi-billion-dollar cost of grid stabilization down to families and small businesses. Consumer electricity prices in high-regulation states are rising faster than inflation, creating a regressive tax on the working class to subsidize the solar panels of the wealthy.
As we descend into the bottom half of the data, a chilling pattern emerges across the American South. Georgia (7%), Missouri (5%), Louisiana (4%), Alabama (3%), Tennessee (2%), and Florida (1%) are effectively opted out of the modern energy transition.
Florida’s number is particularly damning. The “Sunshine State” sits at a pathetic 1% renewable energy share. Think about the sheer irony of that statement. It is a stunning display of utility regulatory capture. The major investor-owned utilities in the South have successfully lobbied for decades to maintain their monopoly on natural gas and aging nuclear plants, actively killing rooftop solar incentives and delaying utility-scale developments.
| State | Renewable Share (%) | Structural Reality |
| Georgia | 7% | Betting heavily on massive, over-budget nuclear expansions (Vogtle). |
| Missouri | 5% | Deeply entrenched coal dependency with minimal state policy support. |
| Louisiana | 4% | Petrochemical corridor reliant entirely on heavy, high-heat fossil energy. |
| Alabama | 3% | Hydro-electric legacy baseline with zero modern solar/wind adoption. |
| Tennessee | 2% | Tennessee Valley Authority (TVA) locked into nuclear and gas assets. |
| Florida | 1% | Absolute monopoly utility resistance to decentralized rooftop solar. |
| Arkansas | 0.7% | Agricultural economy with no legislative drive for green transition. |
| Nebraska | 0.6% | Public power districts favoring coal and gas for low consumer rates. |
| North Carolina | 0.5% | Regulatory structures bottlenecking independent renewable developers. |
| Alaska | 0.5% | Extreme geography and fossil resource abundance making wind impractical. |
| Mississippi | 0.5% | Pervasive poverty and lack of capital preventing infrastructure overhauls. |
| Utah | 0.2% | Abundant coal resources and political resistance to federal green mandates. |
| 14 States | 0% | Complete regulatory, geographic, or political rejection of renewable integration. |
(The Golden Opportunity): The massive swath of low and zero-percent states represents an untapped, trillion-dollar market for next-generation baseload technologies like small modular nuclear reactors (SMRs) and enhanced geothermal energy that don’t rely on weather patterns or massive land footprints.
The danger here is systemic risk. The South is the manufacturing relocation capital of the United States. As global corporations demand clean energy profiles for their supply chains to meet international climate standards, these zero and low-percent states are setting themselves up for a massive economic shock. They face a choice: break the monopoly of the traditional utility companies or watch their industrial manufacturing bases flee to regions with a cleaner grid matrix.
The fundamental lie of the current energy strategy is that generation is the problem. It isn’t. We know how to build wind turbines and solar farms. The bottleneck is the transmission infrastructure.
To connect the wind of the Great Plains and the sun of the Southwest to the major industrial and population centers of the East Coast and the Midwest, the U.S. needs to double its high-voltage direct-current (HVDC) transmission lines. Under current regulatory frameworks, it takes between 7 to 15 years to get a single interstate transmission line approved, cleared of environmental lawsuits, and constructed.
The money allocated by federal bills is piling up in bank accounts because developers cannot get permission to connect their projects to the grid. The queue for grid interconnection across the United States currently contains more generation capacity than the entire existing U.S. power grid. It is an economic traffic jam of epic proportions.
[Current U.S. Grid Capacity]  ████████████████████
[Interconnection Waiting List] ██████████████████████████████
While politicians give speeches about a green future, the actual engineering reality is a story of decay and grid vulnerability. The average transformer on the American grid is over 40 years old. Adding highly volatile, intermittent power sources to an aging, brittle distribution network without massive baseline upgrades is an invitation to systemic grid failure.
The current trajectory is unsustainable. The data proves that the United States cannot achieve a uniform, nationwide green transition using wind and solar alone. The geographic and political rifts are too deep.
By 2030, the illusion of a smooth transition will completely shatter. The top-performing states (Washington, Iowa, Oregon) will hit a hard ceiling where adding more intermittent renewables will actively destabilize their local grids without trillions of dollars in energy storage investments that do not currently exist at scale. Meanwhile, the fourteen 0% states will continue to face intense international economic pressure as global supply chains penalize fossil-fuel-reliant production.
By 2047—the centenary of modern industrialization and a key milestone for global climate targets—the American energy map will look entirely different than the one envisioned by current policymakers. Wind and solar will be recognized as regional niche solutions, highly effective in the Great Plains and the Southwest, but utterly useless for the heavy industrial needs of the Rust Belt and the deep South.
The future belongs to technologies that offer the energy density of fossil fuels without the carbon footprint. The 0% states of today will become the economic powerhouses of tomorrow only if they bypass the wind and solar phase entirely and leapfrog straight into Small Modular Nuclear Reactors (SMRs) and Enhanced Geothermal Systems (EGS).
The data does not lie. The U.S. national average of 23% is a ghost story told to keep investors happy. The real story is written in the gap between Washington’s 75% and Kentucky’s 0%. Until we stop treating energy policy as an exercise in moral righteousness and start treating it as a problem of hard, unforgiving physics, the green transition will remain an expensive luxury for the few, paid for by the many.